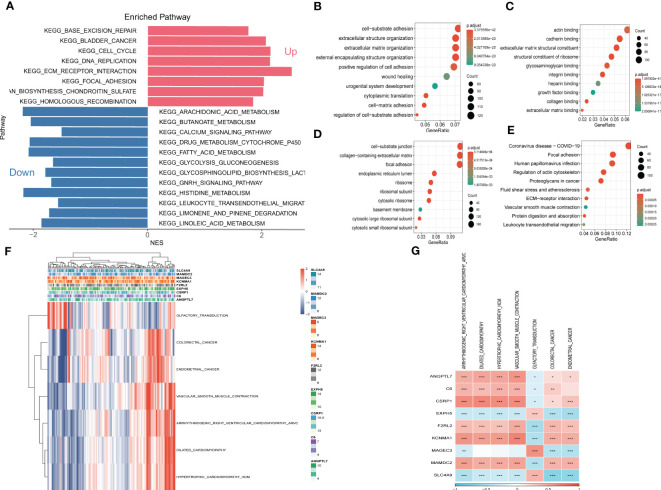
Figure 6.
Gene Set Enrichment Analysis (GSEA) (A) Gene Set Enrichment Analysis of up-regulated and down-regulated genes (B) GO-BP analysis (C) GO-CC analysis (D) GO-MF (E) KEGG analysis (F) Heatmap exhibiting enrichment score for key pathways based on the hub genes. (G) Gene-pathway correlation heatmap.

