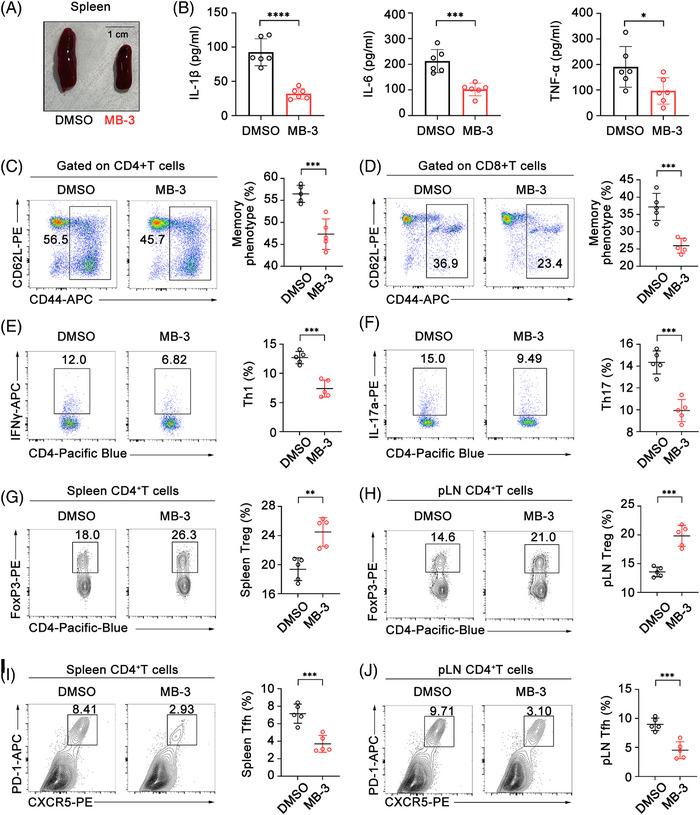
FIGURE 3.

KAT2A inhibitor ameliorates inflammation and immune disorder in CIA model mice. (A) Morphology of spleens from CIA model mice administrated with MB‐3 (10 mg/kg body weight, i.p.) or DMSO. (B) ELISA analysis of concentration of the indicated cytokines in the sera from CIA model mice administrated with MB‐3 or DMSO (n = 6 mice per group). (C and D) Flow cytometric analysis of the percentages of CD44+ memory phenotype CD4+ T cells (C) and CD44+ memory phenotype CD8+ T cells (D) in spleens from CIA model mice administrated with MB‐3 or DMSO (n = 5 mice per group). (E and F) Flow cytometric analysis of the percentages of IFN‐γ‐producing CD4+ T cells (E) and IL‐17a‐producing CD4+ T cells (F) in spleens from CIA model mice administrated with MB‐3 or DMSO (n = 5 mice per group). (G and H) Flow cytometric analysis of the percentages of Treg cells in spleens (G) and pLNs (H) from CIA model mice administrated with MB‐3 or DMSO (n = 5 mice per group). (I and J) Flow cytometric analysis of the percentages of Tfh cells in spleens (I) and pLNs (J) from CIA model mice administrated with MB‐3 or DMSO (n = 5 mice per group). * p < 0.05; ** p < 0.01; *** p < 0.001; **** p < 0.001. Unpaired Student's t‐test (B–J).
