FIGURE 1.

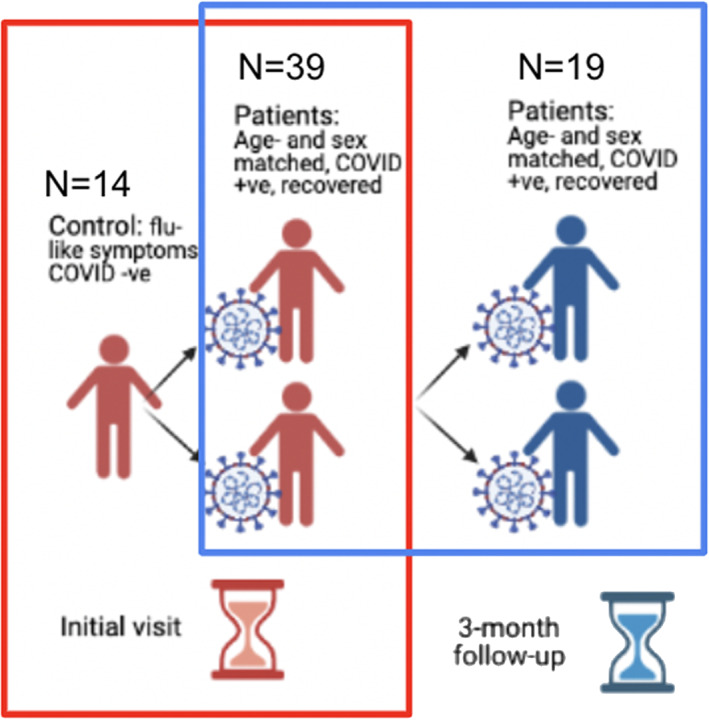
Flowchart of study design. Two sets of comparison were performed: (i) between COVID+ and COVID− groups (outlined by red box) and (ii) between the initial and 3‐month time points in the COVID+ group (outlined by blue box). N = cohort size.

Flowchart of study design. Two sets of comparison were performed: (i) between COVID+ and COVID− groups (outlined by red box) and (ii) between the initial and 3‐month time points in the COVID+ group (outlined by blue box). N = cohort size.