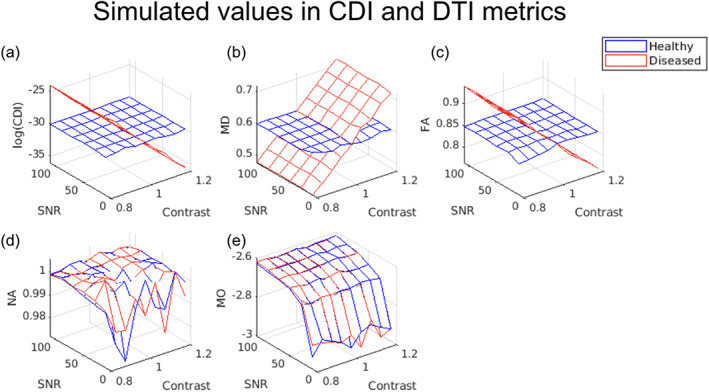
FIGURE 2.

Estimated mean correlated diffusion imaging (CDI) and diffusion tensor imaging (DTI)‐parameter values for simulated healthy and diseased white‐matter tissue. Each vertex on the 3D mesh represents one data point, computed as the average across all noise instances at each SNR. In all cases, a contrast value >1 indicates higher mean diffusivity (MD) in diseased tissue. Increasing MD (b) is reflected as decreasing log(CDI) for diseased tissue (a), with fractional anisotropy (FA) showing minimal difference between health and disease (c). Note that the difference between the simulated healthy and diseased tissues is in MD alone, so as expected, norm of anisotropy (NA) (d) and mode of anisotropy (MO) (e) exhibit negligible contrast between tissue types.
