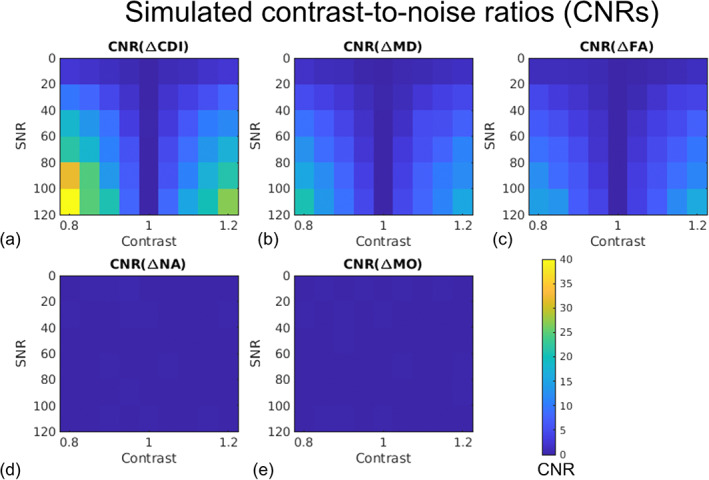
FIGURE 3.

Estimated average contrast‐to‐noise ratios (CNRs) associated with correlated diffusion imaging (CDI) and diffusion tensor imaging (DTI) metrics for distinguishing simulated healthy and diseased white‐matter tissue. Each vertex on the 3D mesh represents one data point. The CNR represents the effect size normalized by estimation variability, and is encoded by the color bar. Note that the difference between the simulated healthy and diseased tissues is in MD alone, so as expected, NA (d) and MO (e) exhibit negligible contrast between tissue types.
