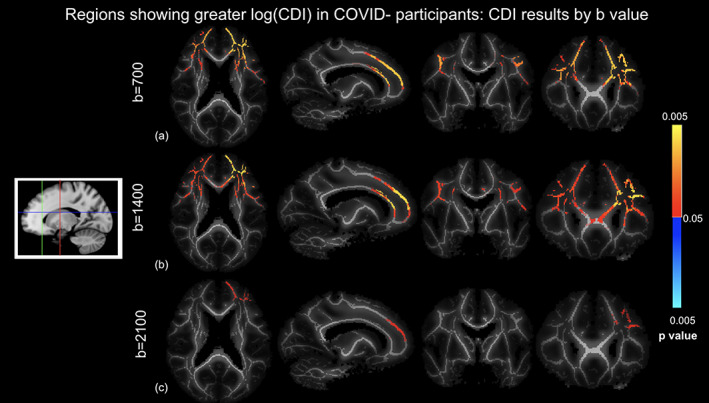
FIGURE 4.

Correlated diffusion imaging (CDI) comparison of COVID+ and COVID− groups based on different b‐values controlled for age and sex differences, where log(CDI) is greater in COVID− participants. (a) b = 700 s/mm2, (a) b = 1400 s/mm2, and (c) b = 2100 s/mm2. Orange‐yellow indicate regions of statistically significant difference, with yellow indicating greater significance. Highest significance in the b = 700 s/mm2 analysis. Slices are taken as shown in the icon to the left.
