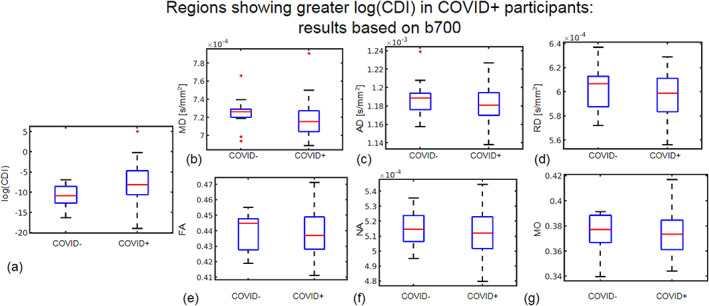
FIGURE 7.

Region of interest (ROI) plots of diffusion tensor imaging (DTI) and log(CDI) values in regions where log(CDI) is greater in COVID+ participants. The ROI is defined as regions where log(CDI) was greater in COVID+ participants based on all gradient directions at b = 700 s/mm2 in the tract‐based spatial statistics (TBSS) analysis. Red line represents the median, the blue box represents the interquartile range, and black lines represent minimum and maximum. The left and right boxes represent the COVID− and COVID+ groups, respectively. Larger median in the COVID+ group is evident in log(CDI) (a) and MO (g). Larger median in the COVID− group is evident in mean diffusivity (MD) (b), axial diffusivity (AD) (c), RD (d), fractional anisotropy (FA) (e), and norm of anisotropy (NA) (f).
