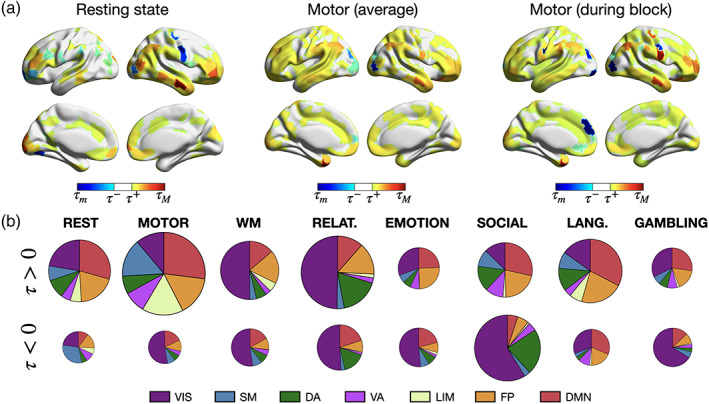
FIGURE 3.

Distinct regional arrow‐of‐time patterns are observed across paradigms. (a) At rest (left), for the full motor task (middle) and when only motor task epochs are considered (right), significant regions in terms of AoT strength. (): minimum (maximum) value of , (): lower (upper) significance threshold at using Bonferroni correction. (b) For each analyzed paradigm, respective contribution of each of seven canonical networks (Yeo et al., 2011), shown separately for positive‐valued and negative‐valued . All areas (including non‐significant ones) are included in this representation. The size of a pie chart is proportional to overall AoT strength in the paradigm at hand.
