
FIGURE 11.
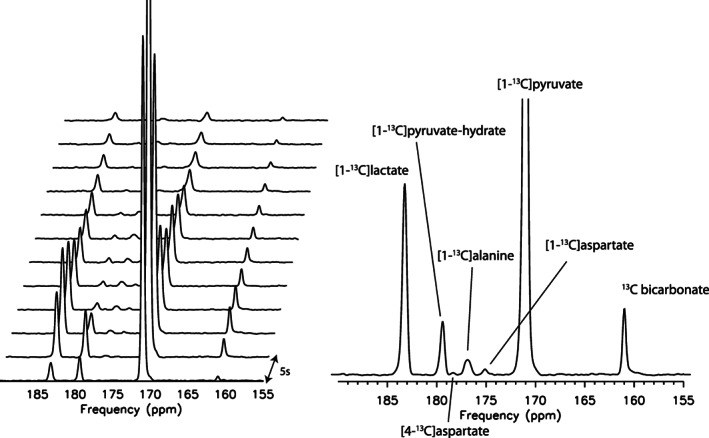
Representative spectroscopy data from one participant. Spectra were acquired every 5 s, separately plotted (left) and summed (right). Note the peaks from [1‐13C]aspartate and [4‐13C]aspartate, indicative of pyruvate carboxylation in the brain.