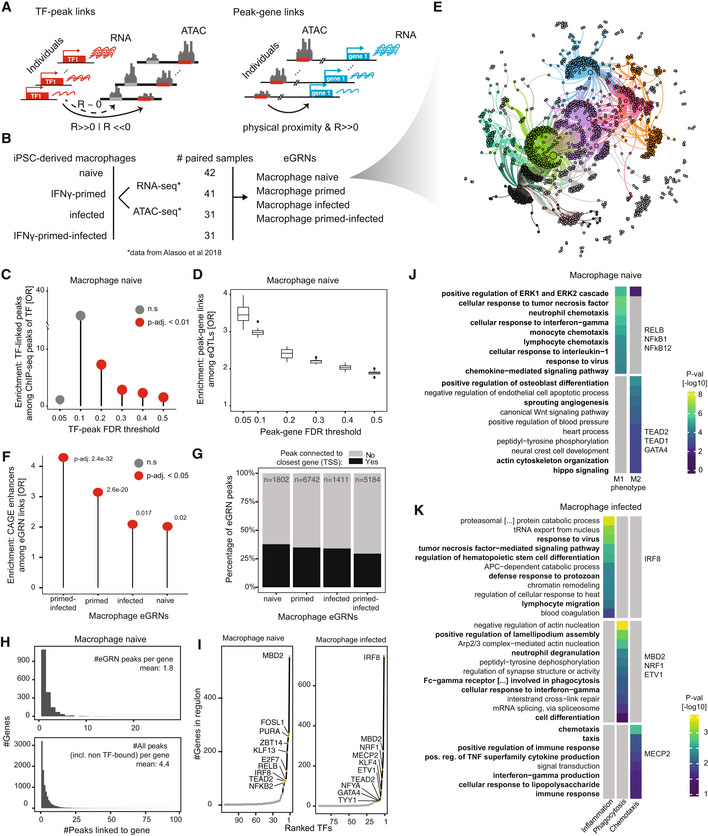
Figure 1. Overview, application and validation of GRaNIE.

-
ASchematic of the eGRN construction by GRaNIE, including the TF to peak (left) and peak to gene (right) links (detailed workflow in Appendix Fig S1).
-
BDatasets used for macrophage eGRN construction and evaluation.
-
CValidation of the eGRN TF‐peak links with ChIP‐seq data. Enrichment of ChIP‐seq peaks overlapping a GRaNIE‐inferred TF‐bound peak (same TF) are shown for different TF‐peak FDRs in the naive macrophage eGRN. Statistical significance was determined using Fishers Exact test; test set: all TF‐peak pairs where the peak contains the motif for the respective TF (n = 25,205, 39,408, 78,971, 109,228, 142,548, 147,226 for TF‐peak FDR 0.05, 0.1, 0.2, 0.3, 0.4, 0.5 respectively), categories: overlap with ChIP‐seq signal, part of GRaNIE‐infer network. Only TFs for which ChIP‐seq data was available are considered (see Appendix Fig S2 for other eGRNs).
-
DValidation of the eGRN peak‐gene links with macrophage eQTLs. Plots show the enrichment of eGRN links overlapping an eQTL over randomly sampled distance‐matched peak‐gene links for different peak‐gene FDRs in the naive macrophage eGRN (see Appendix Fig S3 for other eGRNs). Boxplots: central band: 50% quantile, box: interquartile range (25–75%); whiskers: max/min are 1.5 IQR above/below the box.
-
EForce‐directed visualisation of the naive macrophage eGRN (see Appendix Fig S4 for the other eGRNs). The colours correspond to the identified communities.
-
FEnrichment of macrophage‐specific FANTOM5 CAGE enhancers among the macrophage eGRN peaks. Statistical significance was determined with Fisher's exact test; test set: all peaks that were considered for peak‐gene connections (ATAC consensus peaks located within 250 kb of a TSS of a gene with mean normalised expression across samples > 1) in each eGRN (n = 210,083, 227,035, 227,120 and 219,823 peaks for the naive, infected, primed and primed‐infected eGRN, respectively), categories: overlap with CAGE enhancer, part of GRaNIE network.
-
GFraction of eGRN peaks connected to the closest gene (black) versus other (grey) genes for the macrophage eGRNs.
-
HNumber of peaks linked to a gene shown as histogram for eGRN peaks (top) and all peaks (including non‐TF bound; bottom) for the naive macrophage data (see Appendix Fig S7 for other eGRNs). Mean number of peaks indicated in the panels.
-
INumber of genes connected to each TF for the naive macrophage eGRN (top 10 TFs are labelled).
-
J, KGO enrichment and associated P‐values for selected communities from the naive (J) and infected (K) macrophage eGRN (see Dataset EV7 for the full table of enrichments across communities for all macrophage eGRNs).
