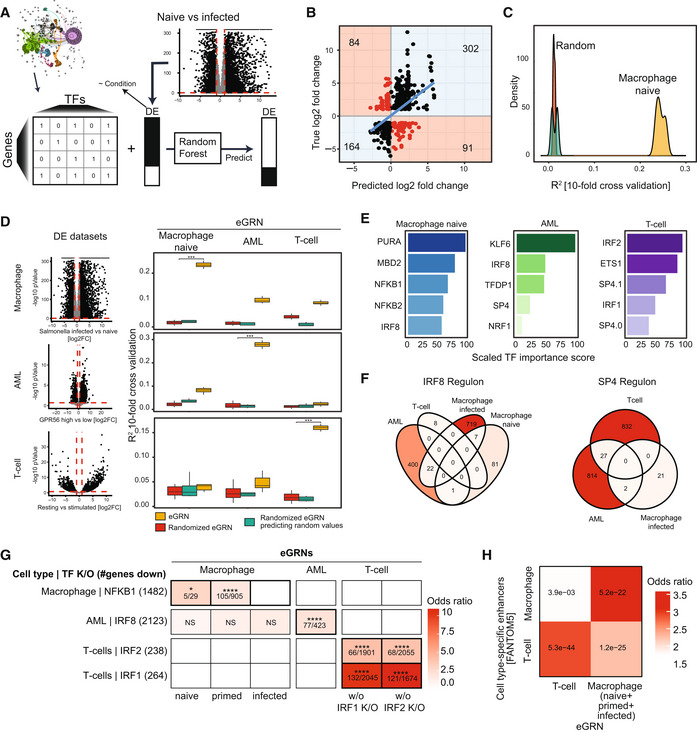
Schematic of the general GRN evaluation approach GRaNPA.
Output of GRaNPA is shown as true versus predicted log2 fold‐changes for the macrophage expression response to Salmonella infection. Predictions are based on the naive macrophage eGRN (see Appendix Fig
S10 for the other macrophage eGRNs).
Output of GRaNPA is shown as density distribution of R
2 for 10 random forest runs for the naive macrophage eGRN predicting differential expression upon Salmonella infection, along with the two permuted controls.
GRaNPA evaluation of eGRNs for naive macrophages (left), AML (middle) and T‐Cells (right) of differential expression from macrophages infected with Salmonella versus naive (top), two subtypes of AML (middle), and resting versus stimulated T‐cells (bottom). Red lines indicate the log2 fold‐change (vertical line) and P‐value (horizontal line) thresholds for genes included in the GRaNPA analysis. Distributions of R
2 from distinct random forest runs (n = 10) are shown as boxplots; t‐tests were performed to compare GRaNPA performance between the permuted and real networks (***P < 0.001). Boxplots: central band: 50% quantile, box: interquartile range (25–75%); whiskers: max/min are 1.5 IQR above/below the box.
Top 5 most important TFs (0.0 and 0.1 indicate distinct TF motifs as defined by the HOCOMOCO database) for each of the eGRNs in (D) based on prediction in the same cell‐type.
Overlap of SP4 (left) and IRF8 (right) regulons between eGRNs from different cell types (only eGRNs with at least one connection to the respective TF are shown).
Enrichment (odds ratio ‐ OR) of NFKB1, IRF8, IRF1 and IRF2 target genes identified in cell‐type specific knockouts (K/O, rows) in the matching macrophage, AML and T‐cell eGRN regulons (columns). Numbers in cells indicate: (# genes in regulon and down in TF K/O)/(# genes in regulon). Asterisks indicate significance using Fisher's exact test; test set: all protein‐coding genes; categories: gene in regulon, gene down in TF K/O (NS: non‐significant, *P‐adj. < 0.05, ****: < 0.001). White squares indicate empty regulons.
Enrichment of T‐cell and macrophage‐specific FANTOM5 CAGE enhancers among the T‐cell and macrophage eGRN peaks. The numbers inside the tiles are BH‐adjusted P‐values based on Fisher's exact test; test set: all peaks in the respective cell types (102,141 and 248,844 for T‐cells and macrophage eGRNs, respectively); categories: peak in eGRN, peak overlap with CAGE enhancer. The macrophage eGRN is the union between the infected, naive and primed eGRNs.

