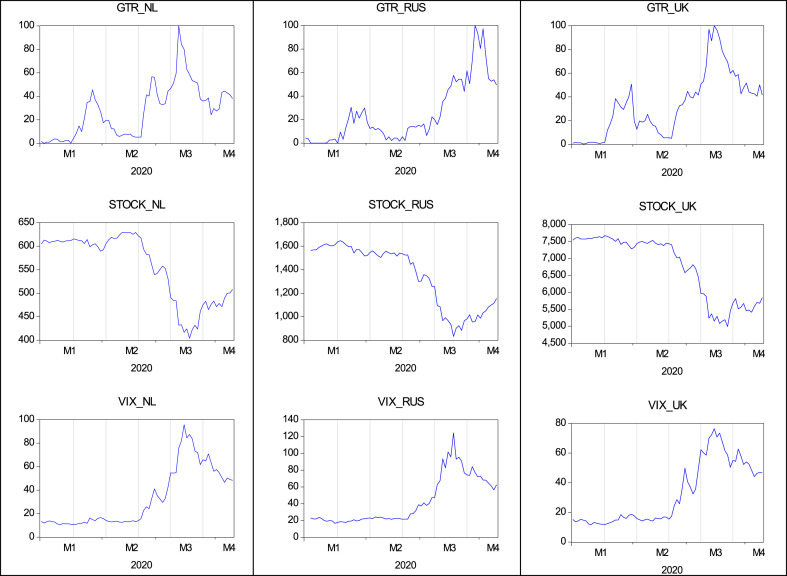
Fig. 1b.
Google Trend on Coronavirus, Stock & VIX prices in European Countries. Notes: The horizontal lines of the figure present a) the GTR metric (Google Trend on Coronavirus) in each country, b) the Stock prices (stock prices of general index) in each country, c) the VIX prices (Implied Volatility index prices) in each country. The tickers for each country are presented as follows NL: Netherland; RUS: Russia; UK: United Kingdom. M1, M2, M3, M4 in the x-axis of the sub-figures represent months of year 2020.

