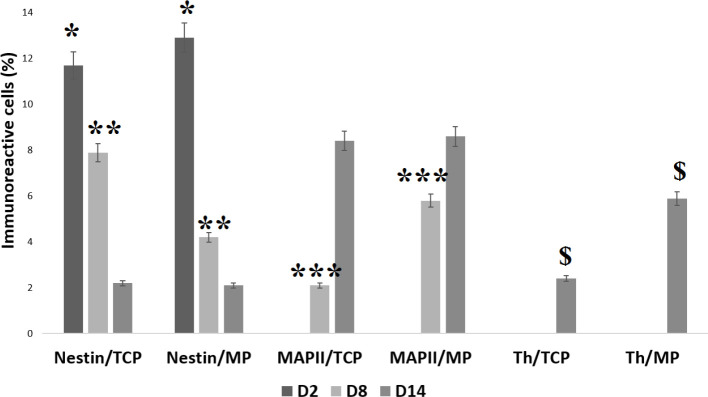
Figure 3.
Histogram of the Percentage of Human Umbilical Cord-Derived Mesenchymal Stem Cells Differentiated in Matrigel Culture Plate and Tissue Culture Plate on days 2, 8, and 14
Values are expressed as mean±standard deviation (n=3). * indicates the statistical significance of Nestin expression between Matrigel culture plate and tissue culture plate on day 2 (P<0.05). ** indicates the statistical significance of Nestin expression between Matrigel culture plate and tissue culture plate on day 8 (P<0.01). *** indicates the statistical significance of MAP2 expression between the Matrigel culture plate and tissue culture plate on day 8 (P<0.001). $ indicates the statistical significance of TH expression between the Matrigel culture plate and tissue culture plate on day 14 (P<0.05).

