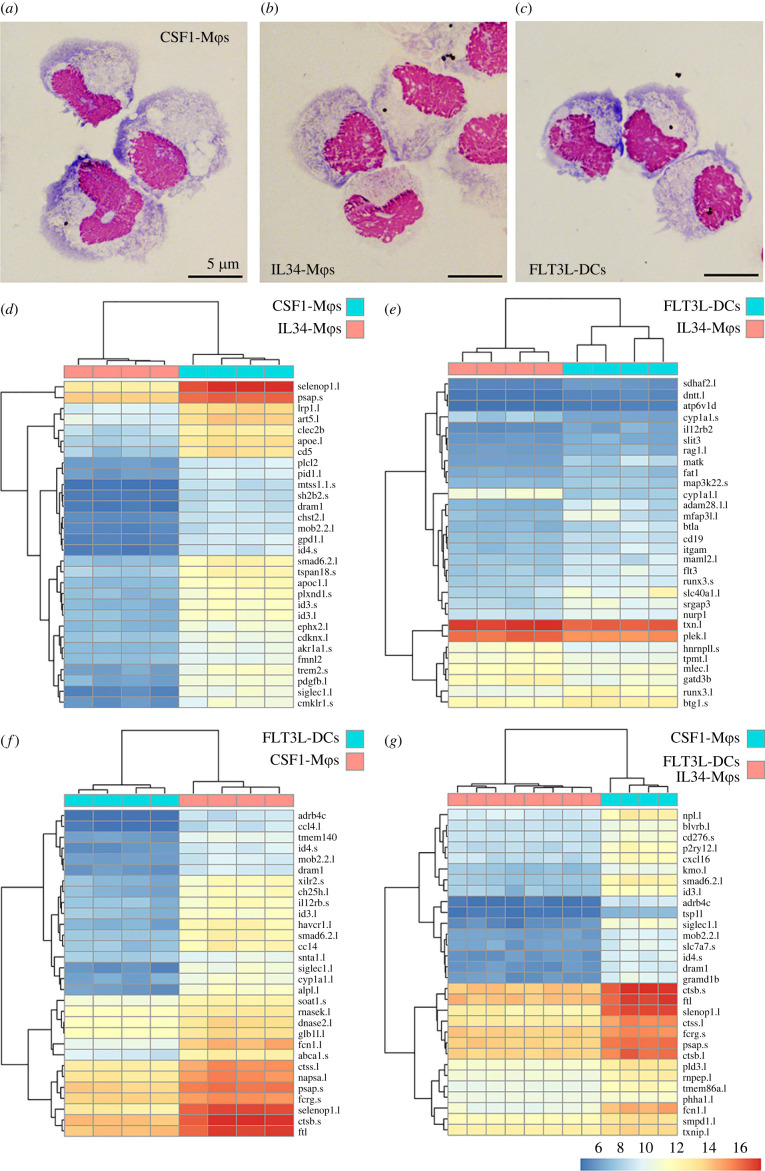
Figure 1.
Morphology and transcriptional profiles of X. laevis CSF1-Mϕs, IL34-Mϕs and FLT3L-DCs. Representative morphology of Giemsa-stained (a) CSF1-Mϕs, (b) IL34-Mϕs and (c) FLT3L-DCs. Comparisons of differentially expressed genes between respective myeloid populations were conducted using DESeq2 and the top 30 significantly differentially expressed genes between (d) CSF1-Mϕs and IL34-Mϕs, (e) IL34-Mϕs and FLT3L-DCs, (f) CSF1-Mϕs and FLT3L-DCs, and (g) FLT3L-DCs and IL34-Mϕs compared to FLT3L-DCs are shown as heatmaps (padj value of less than 0.05 and absolute log2 fold change > [1]). For respective comparisons, cells derived from bone marrow of distinct frogs are organized by columns and the differentially expressed genes are presented in rows with the magnitudes of differential expression denoted by colour, as indicated by the colour bar. Any gene names that appear multiple times within respective heat plots were detected as distinct based on model identities, being transcripts from distinct loci and/or being transcript from short and long arm of X. laevis chromosomes, as indicated by ‘.s' or ‘.l' suffixes, respectively. All heatmaps were visualized using the ‘pheatmap' package in R (4.0.2 version). Statistical comparisons were carried out between each of myeloid cell types (d–f) or by comparing FLT3L-DCs and IL34-Mϕs together against CSF1-Mϕs (g; n = 4/cell type). (Online version in colour.)

