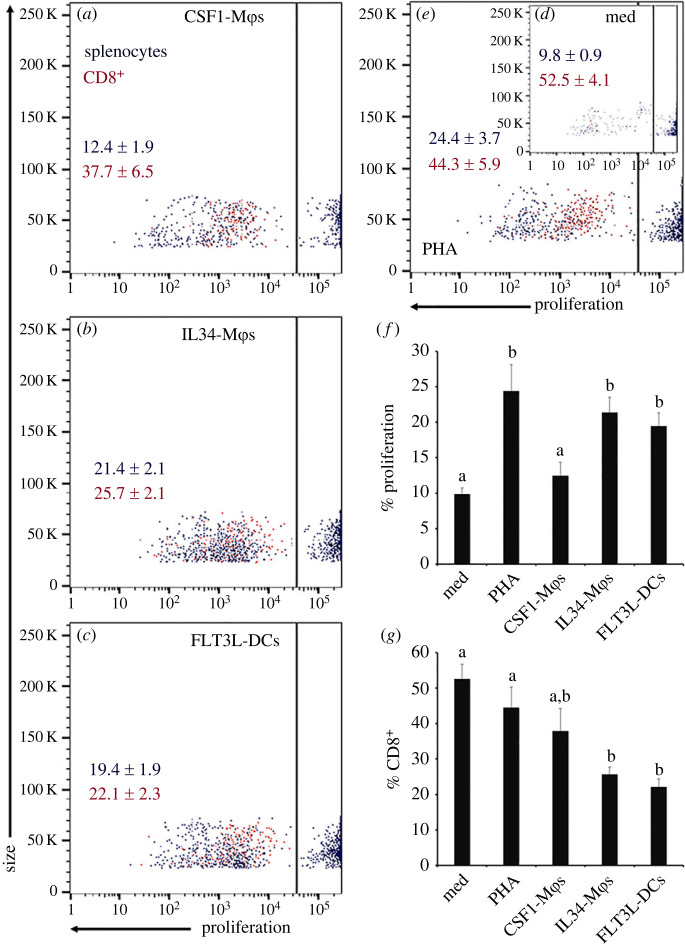
Figure 5.
Comparing the capacities of X. laevis CSF1-Mϕs, IL34-Mϕs and FLT3L-DCs to generate allogeneic (mixed leucocyte) responses. Frog splenocytes were stained using the CellTrace Violet Cell Proliferation Kit and co-incubated with CSF1-Mϕs, IL34-Mϕs or FLT3L-DC cell cultures (five splenocytes per myeloid cell), incubated with medium alone or with phytohemagglutinin-P (PHA; 1 µg ml−1) for 48 h. Cultures were then stained with an anti-X. laevis CD8 (AM22) and DyLight 650-labelled goat anti-mouse IgG secondary antibodies and analysed by flow cytometry. Representative scatter plots of splenocyte proliferation following co-incubation with (a) CSF1-Mϕs, (b) IL34-Mϕs, (c) FLT3L-DCs, (d, inset) medium alone of (e) PHA. Within respective scatter plots, the means + s.e.m. of per cent proliferating splenocytes are in black font and the means ± s.e.m. of the per cent of the proliferating splenocytes that were CD8+ are in red font. (f) Means + s.e.m of proliferating splenocytes (n = 6). (g) Means + s.e.m. of per cent of CD8+ proliferating splenocytes (n = 6). Letters above bars (f,g) indicate statistical significance, with distinct letters representing statistically different groups, p < 0.05.

