
Figure 3.
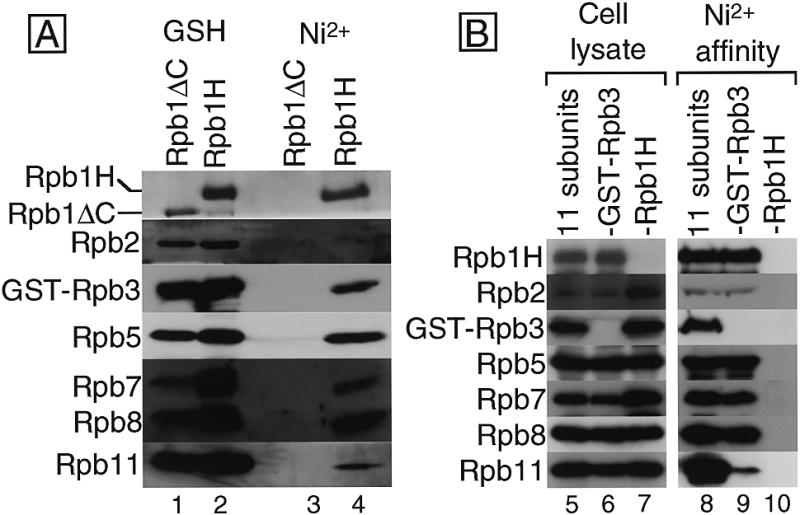
(A) Ni2+-affinity chromatography of the GSH-affinity fractions. Two sets of the 11 subunits, each including Rpb1H or Rpb1ΔC, were coexpressed in two cell cultures and the cell extracts were subjected to GSH-affinity chromatography. The eluted fractions were further purified by Ni2+-affinity chromatography. Each eluted fraction was analyzed by western blotting with antisera against each subunit. Portions of the filters corresponding to the migration positions of each subunit in the SDS–PAGE are arrayed, and the detected subunits are indicated on the left. The affinity columns and the expressed subunits used are indicated on the top: GSH, GSH–Sepharose column; Ni2+, Ni2+–agarose column; Rpb1H, 11 subunits including GST–Rpb3 and Rpb1H; Rpb1ΔC, 11 subunits including GST–Rpb3 and Rpb1ΔC, which lacks both the His10-tag and the CTD. (B) Complex formation without Rpb3. Eleven subunits, or 10 subunits without GST–Rpb3 or Rpb1H were coexpressed and the cell extracts were subjected to Ni2+-affinity chromatography. Cell lysates (cell lysate) and imidazole-eluted fractions from Ni2+–agarose (Ni2+-affinity) were analyzed by western blotting and the portions of the filter are arrayed: 11 subunits, 11 subunits including GST–Rpb3 and Rpb1H; –Rpb3, 10 subunits excluding GST–Rpb3; –Rpb1H, 10 subunits excluding Rpb1H.