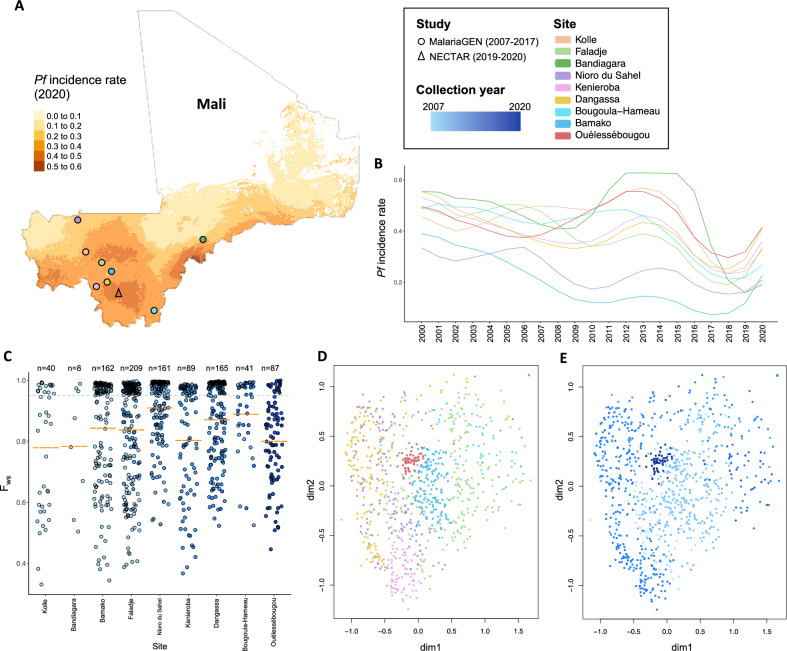
Figure 1.
Population structure of P. falciparum isolates collected in Mali from 2007 to 2020. (A) Map of Mali presenting the number of newly diagnosed Plasmodium falciparum cases per 1,000 population in 2020 (colour scale) and indicating collection sites of the MalariaGEN studies (circle) and the New Drug Combinations for P. falciparum Transmission Reduction (NECTAR) clinical trials (triangle), coloured by village or city name. This map was generated using the tmap R package (version 3.3.3; https://r-tmap.github.io/tmap/) (B) P. falciparum incidence rate for each collection site (by colour) from 2000 to 2020. (C) Complexity of infections estimated by the in-breeding coefficient (Fws metric) per sample, classified per study site, with the colour indicating collection year. Dotted grey trendline is at 0.95, dashed orange marks indicate mean Fws value per group. (D, E) Uniform Manifold Approximation and Projection (UMAP) visualisation of 962 Malian P. falciparum isolates, coloured by site and collection year, respectively.

