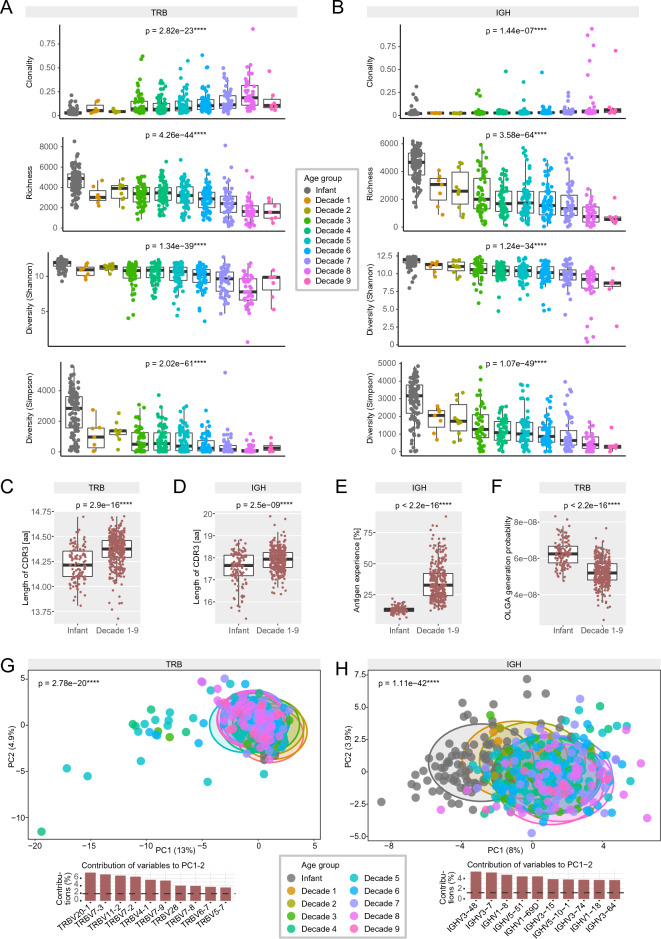
Figure 2.
Blood immune repertoire metrics of LoewenKIDS subcohort sampled at 12 months compared to older control individuals sampled in their 1st to 9th decade of life. (A) T cell receptor (TCR) repertoire clonality, richness and two diversity measures are shown for the LoewenKIDS subcohort (“infant”) versus control immune repertoires from older individuals in their 1st to 9th decade of life (“decade 1–9”; dec). n(dec0) = 116, n(dec1) = 6, n(dec2) = 9, n(dec3) = 54, n(dec4) = 69, n(dec5) = 70, n(dec6) = 63, n(dec7) = 54, n(dec8) = 43, n(dec9) = 7. (B) B cell receptor (BCR) repertoire clonality, richness and two diversity measures are shown for the LoewenKIDS subcohort (“infant”) versus control immune repertoires from older individuals in their 1st to 9th decade of life (“decade 1–9”; dec). n(dec0) = 116, n(dec1) = 7, n(dec2) = 11, n(dec3) = 49, n(dec4) = 55, n(dec5) = 61, n(dec6) = 60, n(dec7) = 48, n(dec8) = 38, n(dec9) = 7. (C) Mean lengths of TCR complementarity-determining region 3 (CDR3) in LoewenKIDS subcohort (“infant”; n = 116) versus controls (“decade 1–9”; n = 377). (D) Mean lengths of BCR CDR3 in LoewenKIDS subcohort (“infant”; n = 116) versus controls (“decade 1–9”; n = 336). (E) Somatic hypermutation (SHM) of BCR in LoewenKIDS subcohort (“infant”) versus controls (“decade 1–9”). (F) Generation probability (Pgen) of TCR rearrangements in LoewenKIDS subcohort (“infant”) versus controls (“decade 1–9”). (G) Principal component analysis (PCA) of TCR V gene usage in LoewenKIDS subcohort (“infant”) versus controls in their 1st to 9th decade of life. V genes contributing most to the repertoire skewing across all age groups are shown. The dotted line indicates the contribution if variables were evenly distributed. (H) PCA of BCR V gene usage in LoewenKIDS subcohort (“infant”) versus controls in their 1st to 9th decade of life. V genes contributing most to the repertoire skewing across all age groups are shown. The dotted line indicates the contribution if variables were evenly distributed. One-way ANOVA was used for Panels (A) and (B). For Panels (C–F) an unpaired two-tailed t-test was performed. For Panels G and H, Pillai-MANOVA was used as statistical test. Analyses and data plotting were performed using RStudio (version 1.1.456) and the tcR, ade4 and tidyverse packages.

