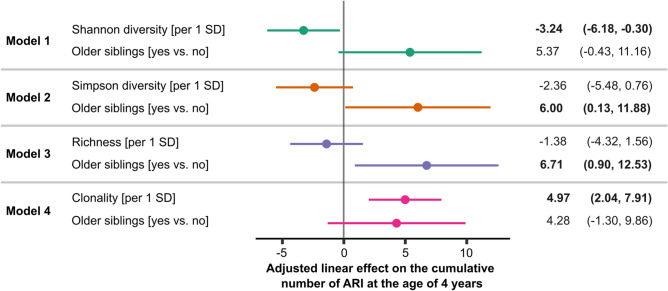
Figure 5.
Adjusted linear effect on the cumulative number of ARI at the age of 4 years. Separate models show the association for each T cell repertoire index (Shannon diversity, Simpson diversity, richness, clonality) in comparison with the effect of older siblings, while mutually adjusting (n = 67). Estimates and 95% confidence intervals are shown. Estimates indicate number of additional infections. Analyses and data plotting were performed using RStudio (version 1.1.456).

