. 2023 Jun 12;13(26):17685–17704. doi: 10.1039/d3ra02883f

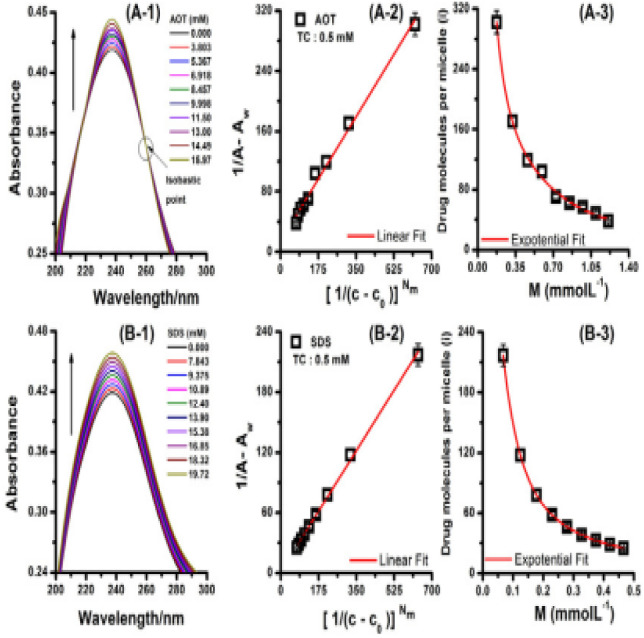
Fig. 8. UV spectra of TC in the presence of AOT and SDS are displayed in plots A-1 and B-1, respectively. Plots A-2 and B-2 depict the TC-AOT and TC-SDS systems. The solid red line in these plots represents the linear fitting that was used to calculate Kb from the slope ratio and intercept. In plots A-3 and B-3, the variation of micelle mean occupancy (determined from absorbance data) with micelle concentration is shown for TC-AOT and TC-SDS. The solid red line in these plots represents the exponential fitting that was used to determine the total mean ion occupancy (i0) from the empirical equation. This figure is reproduced from ref. 49 with permission from Elsevier, Copyright 2021.

Fig. 8