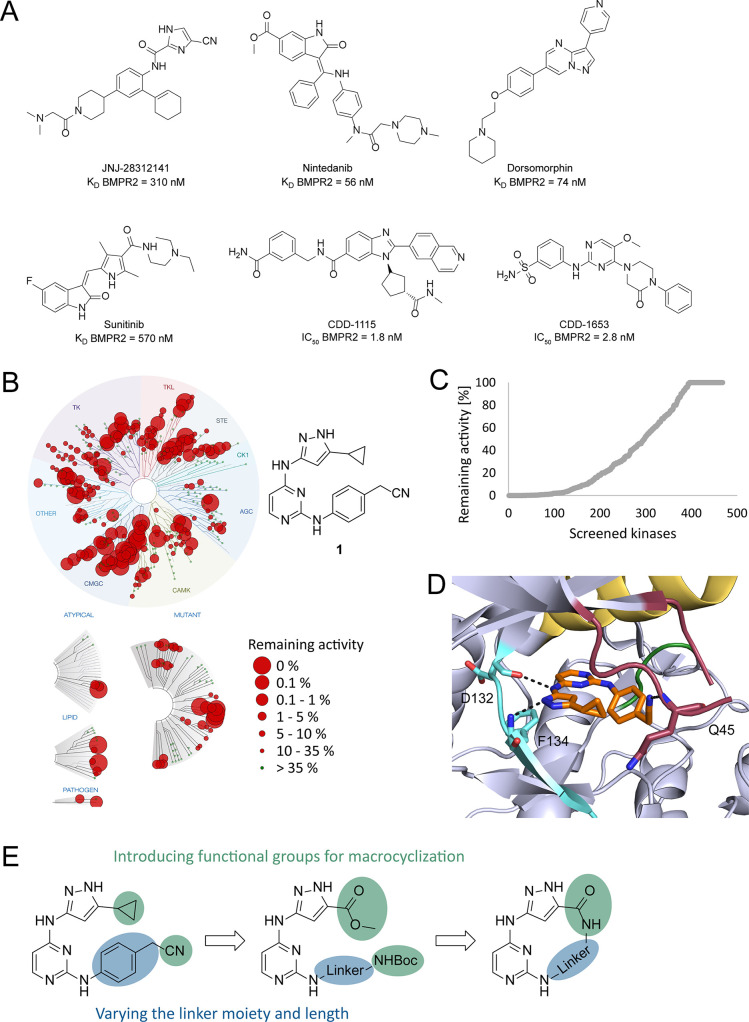
Figure 1.
A. Chemical structures of JNJ-28312141, nintedanib, dorsomorphin, sunitinib, CDD-1115, and CDD-1653, with the corresponding KD and IC50 values reported for BMPR2.23,28,30 B. Selectivity profile of 1 at 1 μM. The chemical structure of 1 is shown beside the dendrogram.31 C. Waterfall plot of the kinome-wide screening data measured for 1 at 1 μM. D. Compound 1 cocrystallized with VRK1 (PDB: 3OP5).31,32 The hinge region is colored light blue, the P-loop red, the altered DFG motif green, and the αC-helix yellow, and compound 1 is illustrated in orange. E. Synthetic strategy used for the development of macrocyclic inhibitors based on 1.

