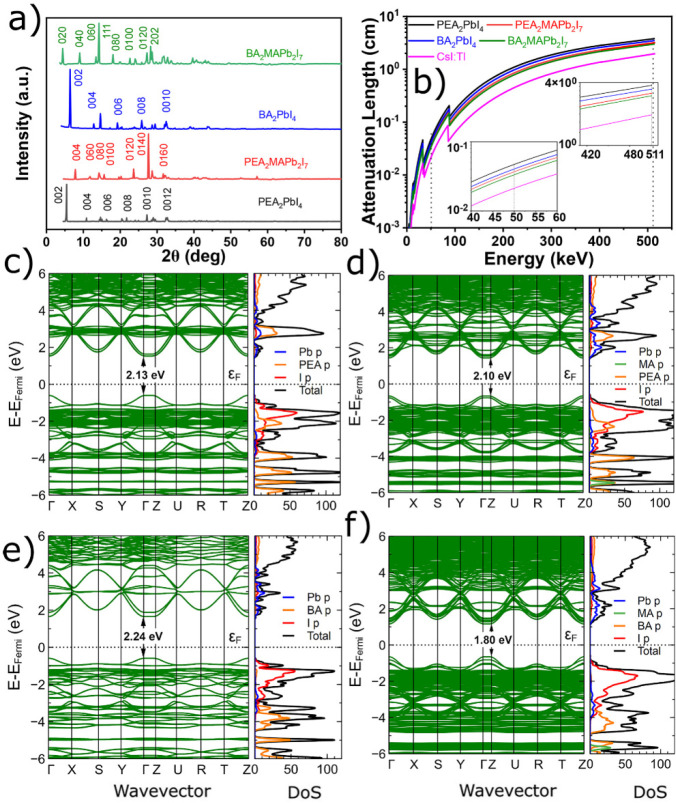
Figure 2.
(a) X-ray diffraction pattern of the crystals. (b) Absorption lengths  calculated for X-ray and γ-ray spectral
region. Inset corresponds to the magnified X-ray spectral region at
50 keV and γ-ray spectral region at 511 keV. Band structure,
total (black) and projected (color) DOS, of (c) (PEA)2PbI4, (d) (PEA)2MAPb2I7, (e)
(BA)2PbI4, and (f) (BA)2MAPb2I7 crystals. The Pb p, PEA p, BA p, MA p, and I
p are represented by blue, orange, pink, green, and red lines, respectively.

