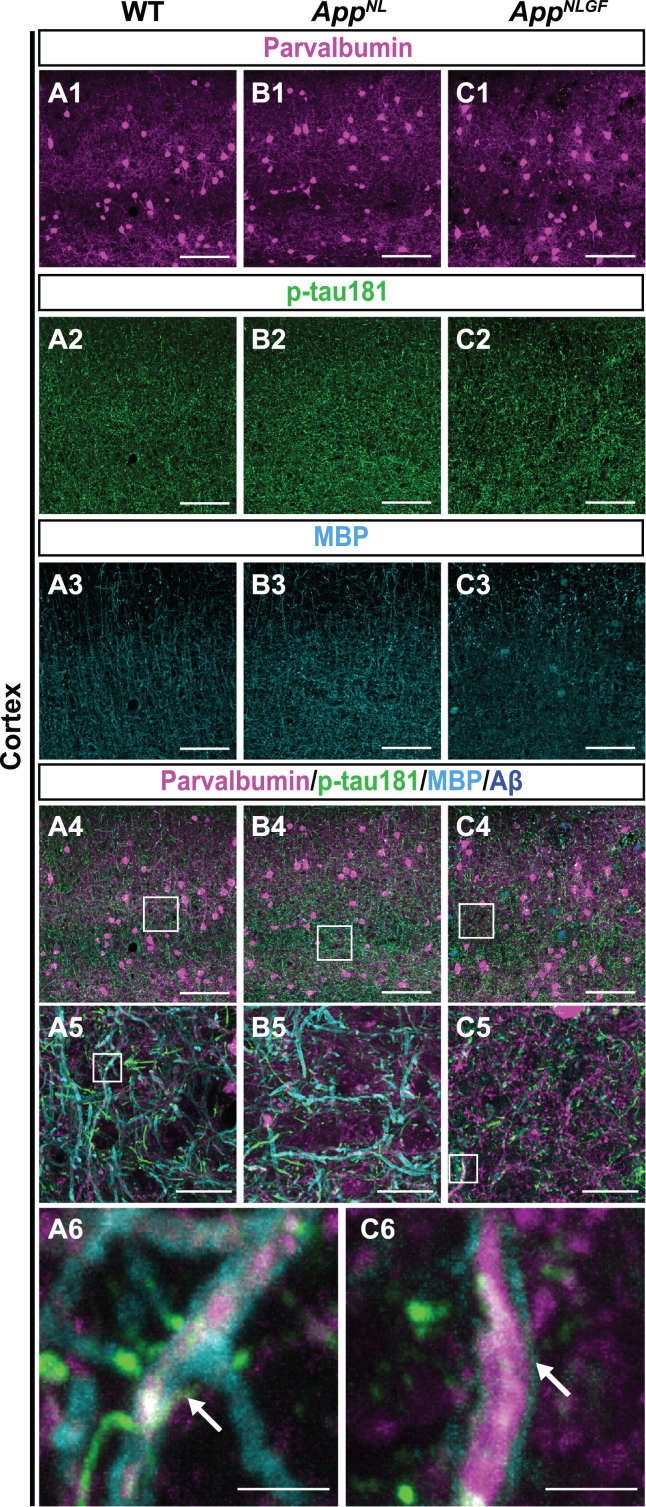
Fig. 7.
p-tau181-positive axons overlap with parvalbumin-expressing axons in mouse brains. (A1– C4) Representative images of the cortex from frozen coronal brain sections immunostained with antibodies against parvalbumin (magenta), p-tau181 (green), and MBP (cyan). FSB was used for detecting Aβ plaques (blue). Scale bars, 100μm. (A5– C5) Higher magnification of framed regions indicated in A4– C4. Scale bars, 20μm. (A6, C6) Higher magnification of framed regions indicated in A5 and C5. White arrows indicate MBP signals enwrapped with the p-tau181-positive axons of parvalbumin-expressing interneurons. Scale bars, 2.5μm.

