
Table 2. In Vitro Profiles of Compound 1.
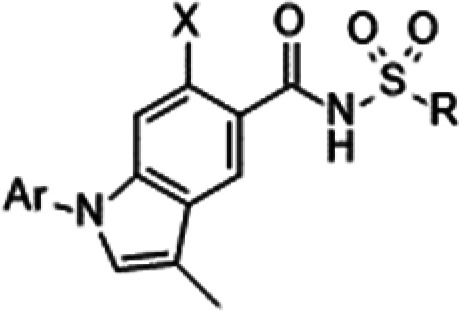
| Ar | X | R | hNaV1.1 IC50 (μM)a | hNaV1.5 IC50 (μM)a | hNaV1.7 IC50 (μM)a | mNaV1.7 IC50 (μM)a | hERG inhibition at 100 μMa,b | Log Dc | Solubility (μM)d | Mouse PB free (%)d | |
|---|---|---|---|---|---|---|---|---|---|---|---|
| 1d | Ph | H | Me | 80 | 79 | 0.33 | 2.7 | 17.1 ± 3.8 | 1.1 | >660 | <0.20 |
| 1f | 2-F-C6H4 | H | Me | NTe | 100 | 5.9 | 12 | NTf | NTf | NTf | NTf |
| 1g | 3-F-C6H4 | H | Me | 12 | 35 | 0.038 | 0.90 | 13.2 ± 6.0 | 1.2 | 600 | <0.20 |
| 1h | 4-F-C6H4 | H | Me | 52 | 42 | 0.19 | 2.8 | 5.6 ± 2.3 | 1.1 | 140 | <0.20 |
| 1i | 3-Cl-C6H4 | H | Me | 20 | 34 | 0.087 | 1.7 | 43.5 ± 11.9 | 1.8 | 620 | <0.20 |
| 1j | 4-Cl-C6H4 | H | Me | >100 | 23 | 0.26 | 7.9 | 51.1 ± 7.6 | 1.8 | 26 | NTf |
| 1k | 3-Me-C6H4 | H | Me | 39 | NTf | 0.058 | 1.6 | 51.0 ± 10.0 | 1.6 | 550 | NTf |
| 1l | 3-MeO-C6H4 | H | Me | 79 | 71 | 0.19 | 2.1 | 18.9 ± 1.6 | 1.2 | 580 | <0.20 |
| 1m | 3-CF3-C6H4 | H | Me | 20 | 27 | 0.034 | 0.68 | 49.8 ± 8.2 | 1.7 | >820 | 0.20 |
| 1n | 3-F-C6H4 | F | Me | >100 | 31 | 0.014 | 0.98 | 15.6 ± 2.6 | 0.8 | 430 | <0.20 |
| 1o | 3-CF3-C6H4 | F | Me | >100 | 14 | 0.019 | 0.016 | 54.8 ± 15.2 | 1.5 | 230 | 0.40 |
| 1p | 3-F-C6H4 | H | c-Pr | 4.8 | 14 | 0.032 | 0.81 | 42.1 ± 5.0 | 1.8 | 440 | <0.20 |
a
Data were obtained with a high-throughput electrophysiology system (IonWorks Quattro). Values are from a single experiment run in quadruplicate.
b
hERG inhibitory activity at 10, 30, and 100 μM was assessed, and the dose response was confirmed. Each value represents the mean ± SD.
c
Distribution coefficients (log D) were measured after partition between 1-octanol and PBS (pH = 7.4).
d
Unbound fractions (%) in mouse plasma.
e
Aqueous thermodynamic solubility at pH 6.8.
f
Not tested.