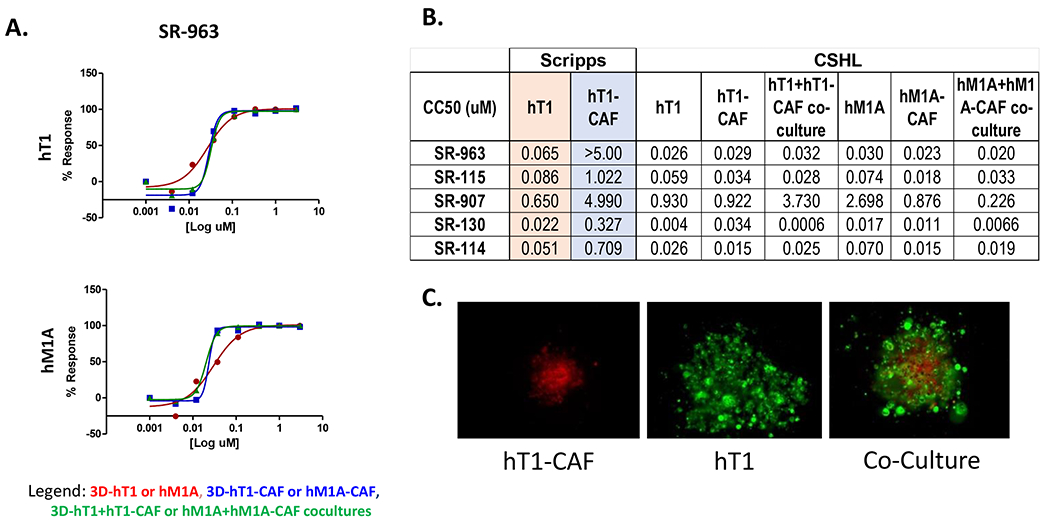
Figure 6. CC50 data of the analogs of SR-963 in the low throughput assays.

(A). SR-963 compound concentration response curve in the Matrigel 3D scaffold assays using hT1, hM1A, CAF and co-cultures pancreatic organoids. Data represent 8-point 3-fold serial dilutions starting at 2.99 μM nominal concentration. (n=3 for each concentration tested). Error bars are included and shown in SD. (B). Table that summarizes the dose response data results of each of the analogs tested for Scripps and CSHL. (C) Image analysis to demonstrate how spheroids and co-culture spheroids look in the assay.
