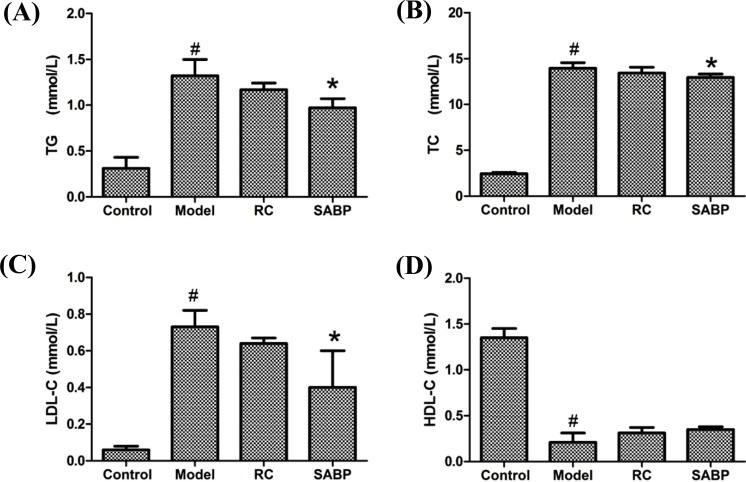
Fig. (1).
TG, TC, LDL-C and HDL-C serum lipid levels in response to SABP treatment. (A) The TG level; (B) The TC level; (C) The LDL-C level; (D) The HDL-C level. Data are presented as the mean ± SD. N = 6 in each group. #P < 0.05, compared with control group;*P < 0.05, compared with the model group.

