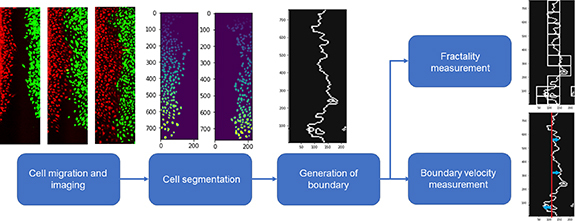
Figure 1.

Schematic of the overall analysis. We take the time series fluorescent images of two groups of cells migrating toward each other and perform segmentation on the two channels. Then we generate the boundary between the two cell groups and calculate fractality of the boundary and the boundary velocity.
