
Figure 5.
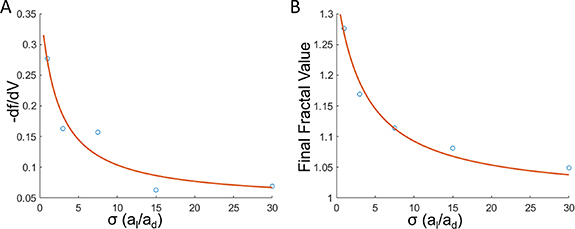
The relationship between σ and fractality/velocity. (A) Plot of the model estimate of interfacial tension versus the absolute value of rate of change of fractal dimension of the boundary with respect to the boundary velocity. (B) Plot of the model estimate of interfacial tension versus the final fractal value at iteration 80 in the simulations. The inverse function fit using nonlinear least squares curve fitting method is shown in red. Five conditions were tested at various ad values while al and pm were held constant.