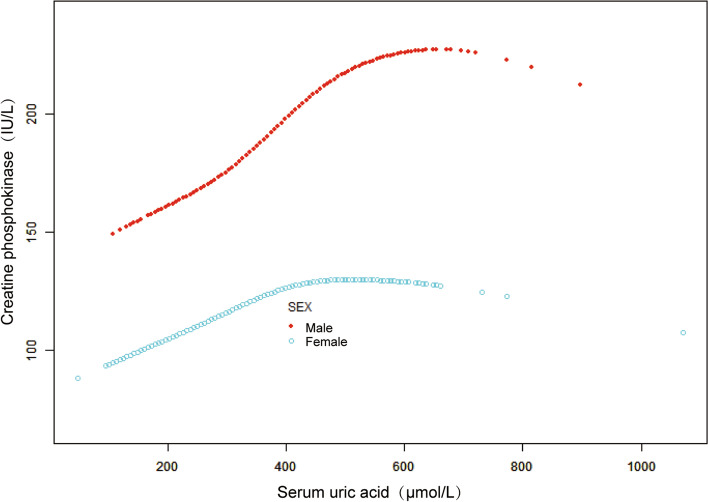
Fig. 3.
The relationship between serum uric acid level and creatine phosphokinase dose–response, stratified by age. Sex, race/ethnicity, education level, income poverty ratio, BMI, waist circumference, physical activity, smoking behavior, alcohol behavior, alanine aminotransferase, aspartate aminotransferase, high-density lipoprotein cholesterol, total cholesterol, triglycerides, low-density lipoprotein cholesterol, total protein, hypertension, diabetes, and weak/failing kidneys were adjusted. Significance of smooth terms: p < 0.001 (Male); p = 0.001 (Female)

