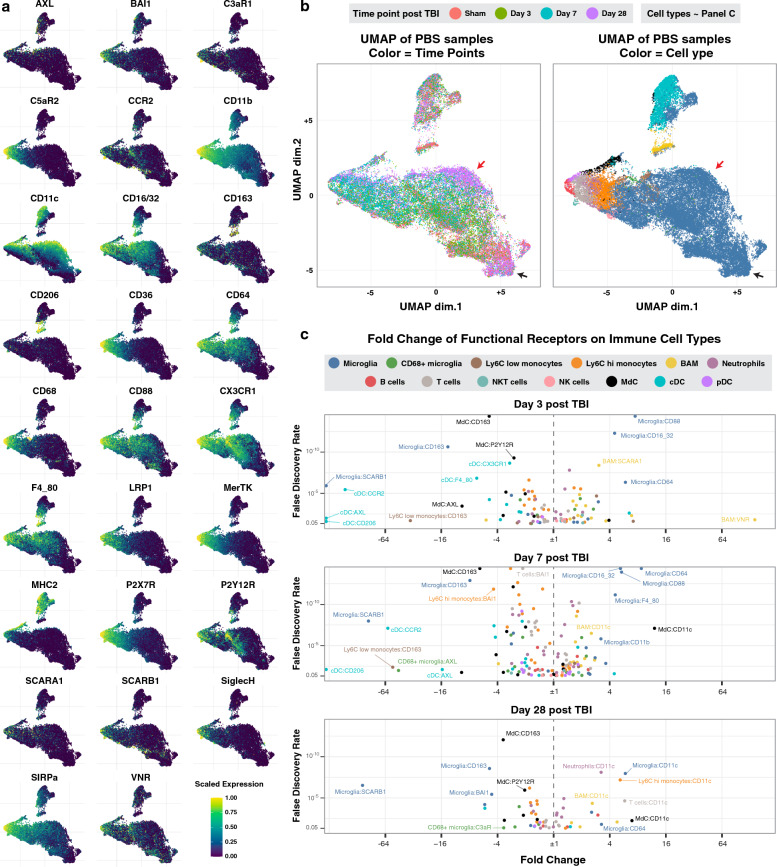
Fig. 2.
TBI modulates the expression of phagocytic and complement receptors on brain resident and infiltrating peripheral immune cells. A Lineage UMAPs of sham and PBS-treated experimental groups showing the relative expression of 26 functional markers. B The same lineage UMAPs color-coded by time point after TBI and immune cell types. Overlay visually with the UMAPs in panel A for an easier understanding of the dynamic expression of the functional markers by time point and cell type. C Volcano plots quantifying the fold change in immune cell expression of the functional markers at all time points in the PBS-treated group compared to the sham group (see also Additional file 1: Fig. S2). Each data point represents the mean in fold change for a receptor-cell type combination. N = 6 per group. False discovery rate was used to adjust the p-value. Abbreviations: cDC = conventional dendritic cell, pDC = plasmacytoid dendritic cell, MdC = monocyte-derived cell

