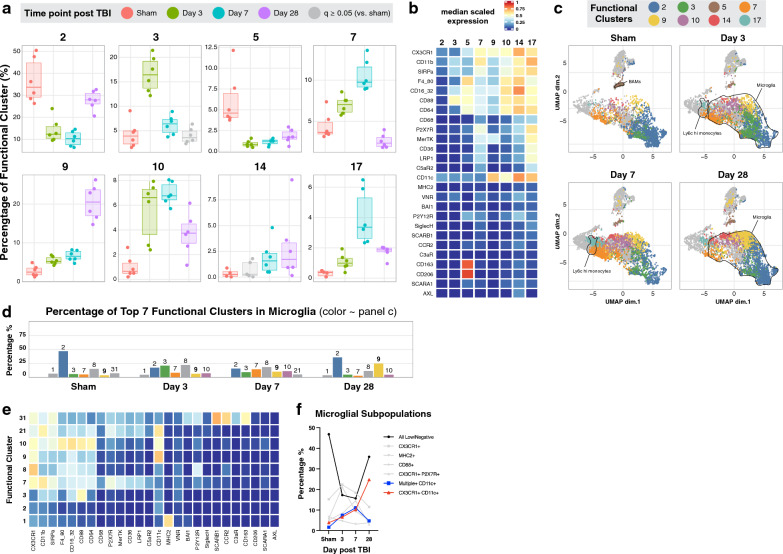
Fig. 3.
The expression of functional markers identifies distinct subpopulations of immune cells that emerge at different phases after TBI. A FlowSOM clustering based on the expression of functional markers identified 40 functional clusters (see also Additional file 1: Fig. S3). In this panel, 8 functional clusters with high differential abundance at different time points are shown here. B Heatmap of the 8 functional clusters showing their median scaled expression of 26 functional markers. C Lineage UMAP color-coded by the 8 functional clusters to show their distribution amongst the 13 immune cell types. The percentage D and heatmap E (same scale as panel B) of the 7 most abundant microglial functional clusters per time point. F Summary of the abundance of distinct microglial functional clusters labeled by the most highly expressed functional markers. Data are shown as mean in panels D and F. A–F N = 6 per group. False discovery rate was used to adjust the p-value in panel A. Abbreviations: cDC = conventional dendritic cell, pDC = plasmacytoid dendritic cell, MdC = monocyte-derived cell

