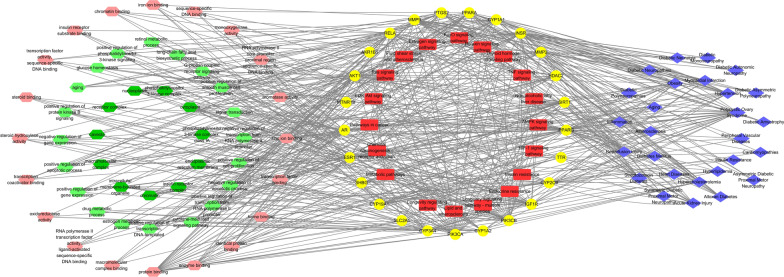
Fig. 4.
Diseases-targets-functional annotations-signaling pathways network. GO terms are shown on the left side. The dark green hexagon represents the cellular component. The light green hexagon represents the biological process. The pink hexagon represents the molecular function. The central yellow circle represents RES targets against DKD. The central red round rectangle represents the enriched KEGG pathway. Diseases enrichment analyses are indicated by blue diamonds on the right side. GO: Gene ontology, RES: resveratrol, DKD: diabetic kidney disease, KEGG: Kyoto Encyclopedia of Genes Genomics

