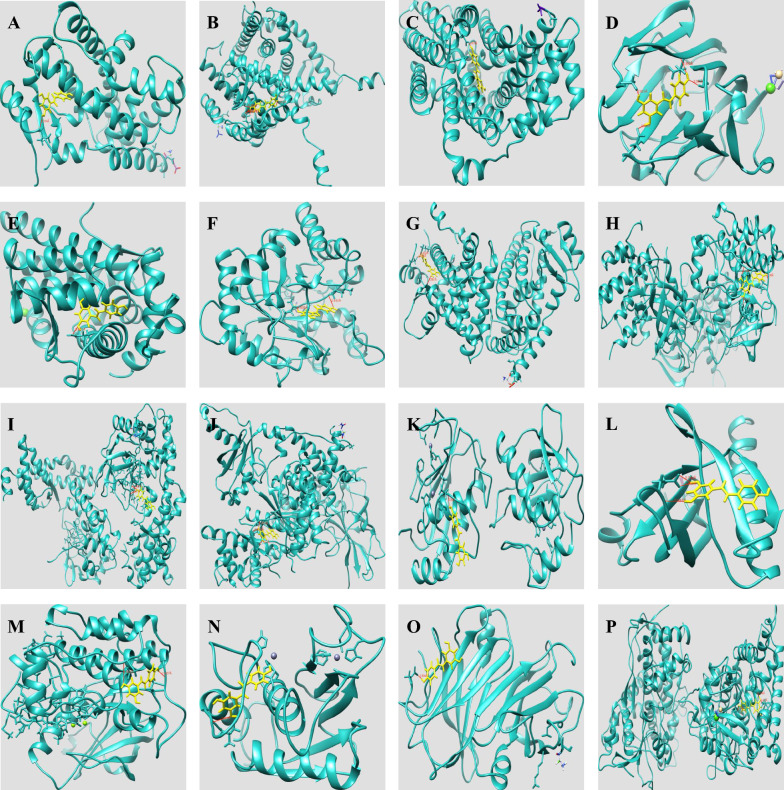
Fig. 5.
The 3-dimensional map of the binding sites between RES and target proteins A PPARA, B ESR1, C SLC2A1, D SHBG, E AR, F AKR1B1, G PPARG, H IGF1R, I RELA, J PIK3CA, K MMP9, L AKT1, M INSR, N MMP2, O TTR, P CYP2C9. RES is shown in yellow. Target proteins are displayed as cyan. The places where RES and the target proteins are connected represent specific docking sites between RES and target proteins. RES: resveratrol

