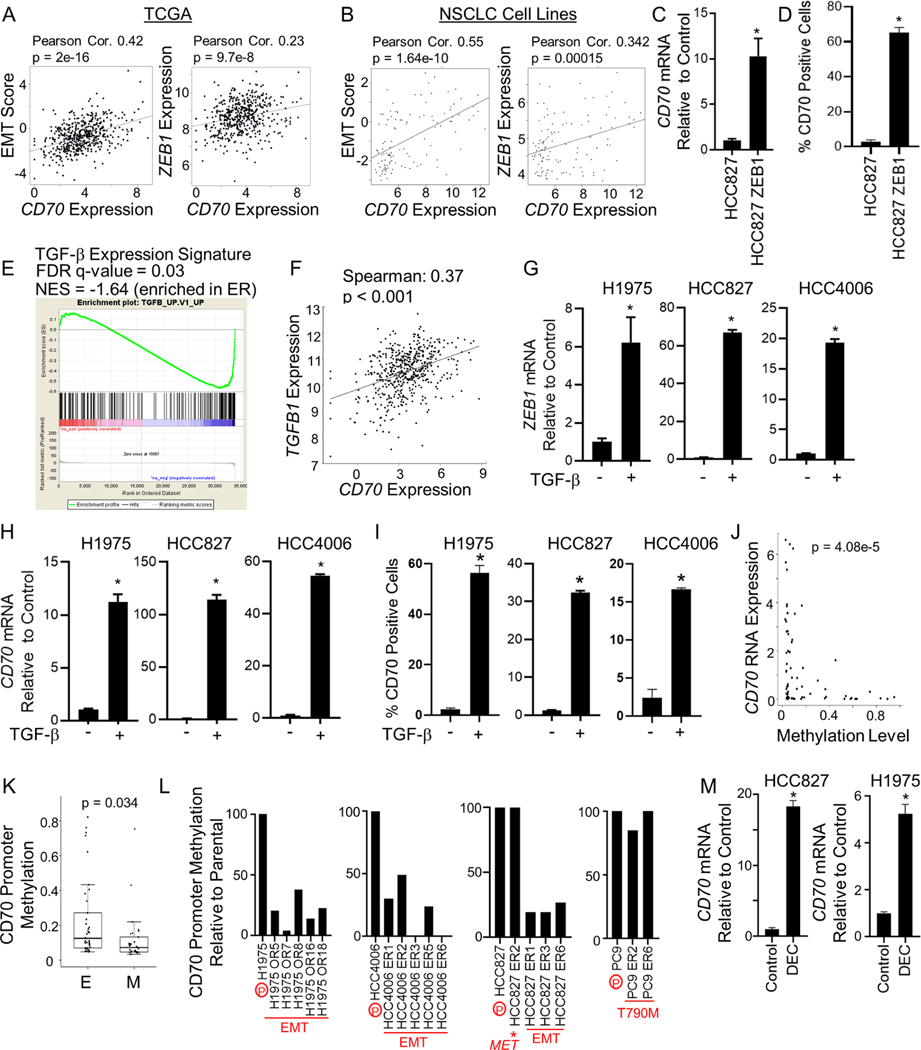
Figure 3. CD70 expression is associated with EMT and epigenetic changes in EGFR mutant NSCLC cells.
(A and B) In NSCLC samples (TCGA-LUAD dataset; A) and across NSCLC cell lines (B), CD70 expression correlated with an EMT expression score (left) and ZEB1 (right). (C) Mean CD70 RNA expression ± SEM in HCC827 cells expressing ZEB1 (n = 3). *p = 0.0096. (D) Mean CD70 positivity ± SD in HCC827 cells with or without ZEB1 (n = 3). *p < 0.0001. (E) GSEA analysis of TGFB expression signature in ER cells that acquired resistance through EMT. (F) Correlation of CD70 and TGFB1 among NSCLC patients (TCGA). (G & H) TGFβ (10 ng/ml) increased ZEB1 (G) and CD70 (H) mRNA. Mean ± SD (n = 3–4). *p < 0.001. (I) Mean CD70 positivity ± SD following TGF-β treatment (n = 2). *p < 0.001. (J) CD70 expression is associated with reduced CD70 promoter methylation. (K) CD70 promoter methylation in epithelial (E) and mesenchymal (M) NSCLC cell lines. Box plots depict the median (line) as well as the 25th and 75th percentile, with whiskers showing 1.5x the interquartile range (IQR). (L) CD70 promoter methylation in parental (P) and osimertinib resistant (OR) and erlotinib resistant (ER) cells. (M) Mean CD70 ± SD expression following exposure to decitabine (DEC; 1 μM; n = 3). *p < 0.0001. Student’s t test was used for C, D, G, H, I, K, M.
See also Figure S2.

