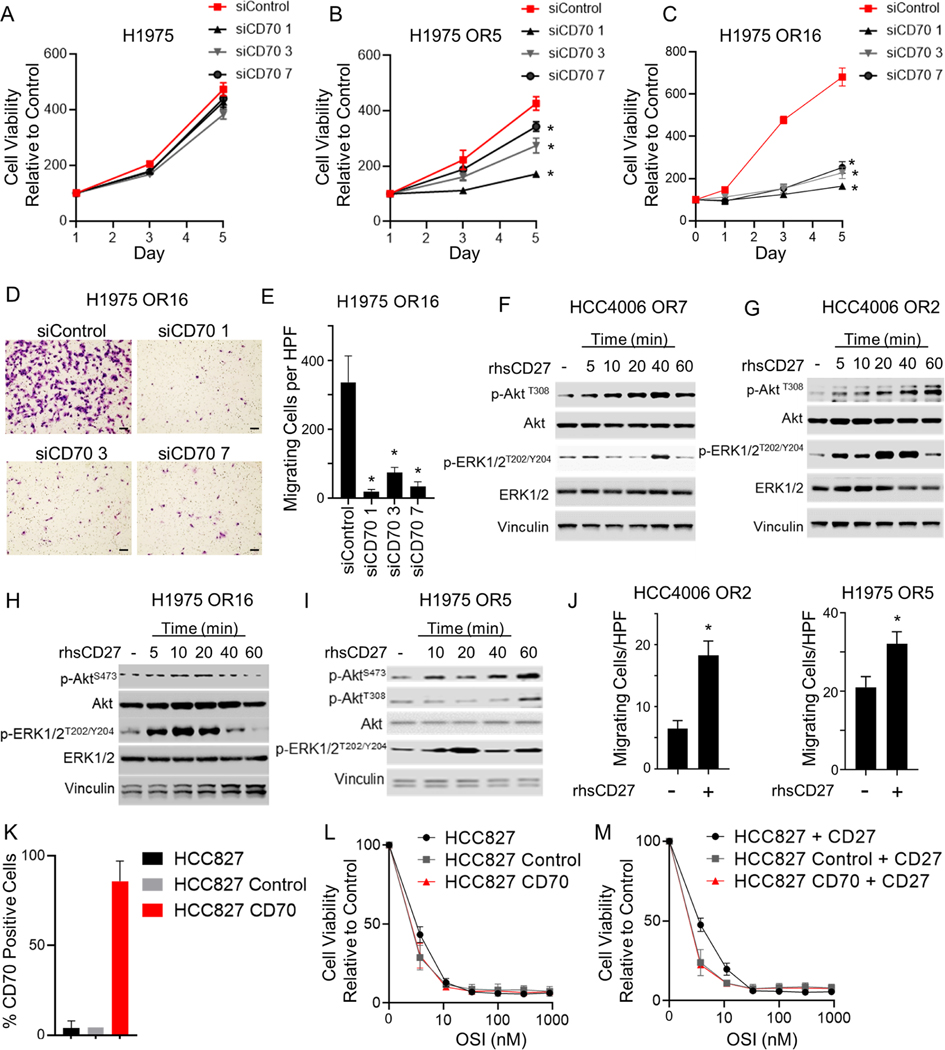
Figure 4. CD70 activates signal transduction in EGFR TKI resistant cells and regulates survival and invasive pathways.
(A-C) Growth rate of H1975, H1975 OR5, and H1975 OR16 following CD70 knockdown (n = 4). Data points are mean viability ± SD. p < 0.001. (D & E) Representative images and high-powered field (HPF) quantification of mean number of migrating H1975 OR16 cells ± SD after CD70 knockdown. *p < 0.0001. (n=3) Scale bars = 1000 μm. (F – I) p-AKT and p-ERK1/2 following stimulation with rhsCD27. (J) Mean number of migrating cells ± SEM following stimulation with rhsCD27 (n = 3). *p < 0.05; student’s t-test. (K) Mean CD70 positivity ± SD in HCC827 cells engineered to overexpress CD70. (L & M) Osimertinib (OSI) dose response curve for HCC827 cells with or without CD70 or rhsCD27. Mean ± SD (n = 3). One-way ANOVA was applied for A, B, C, E.
See also Figure S3.

