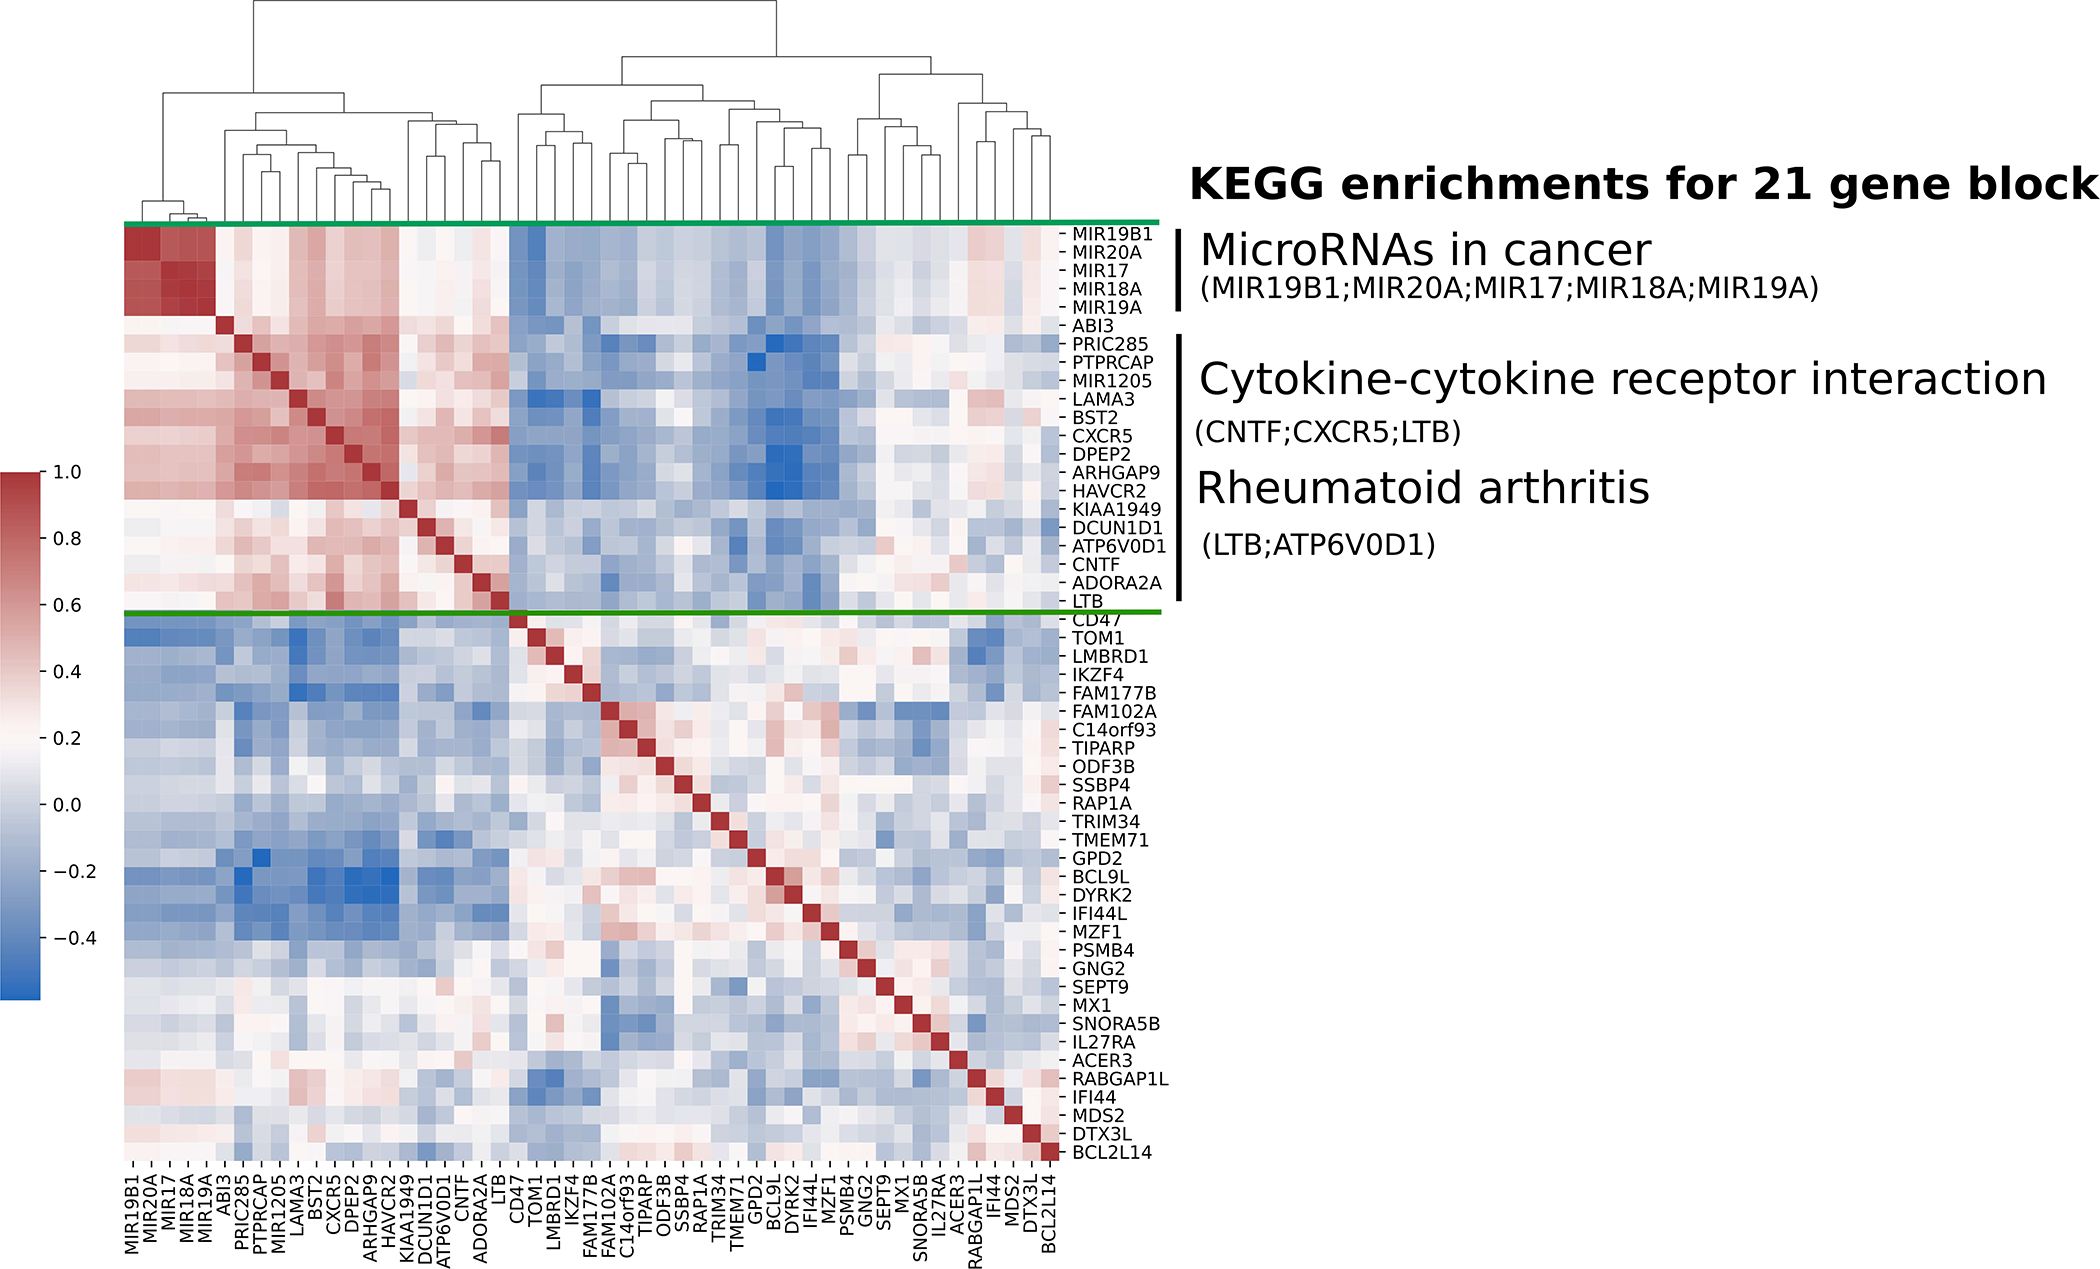
Figure 2.

Heatmap of hierarchical clustering of pairwise Pearson correlation coefficient values of 51 differentially methylated gene promoters (TSS1500) in global tissue signature derived from 16,541 samples. Range from +1 (red) to −1 (blue), represent a greater to lower correlation in global tissue, respectively. KEGG pathways are significantly enriched (FDR-adjusted P-value < 0.05) in a block of 21 genes (green bars).
