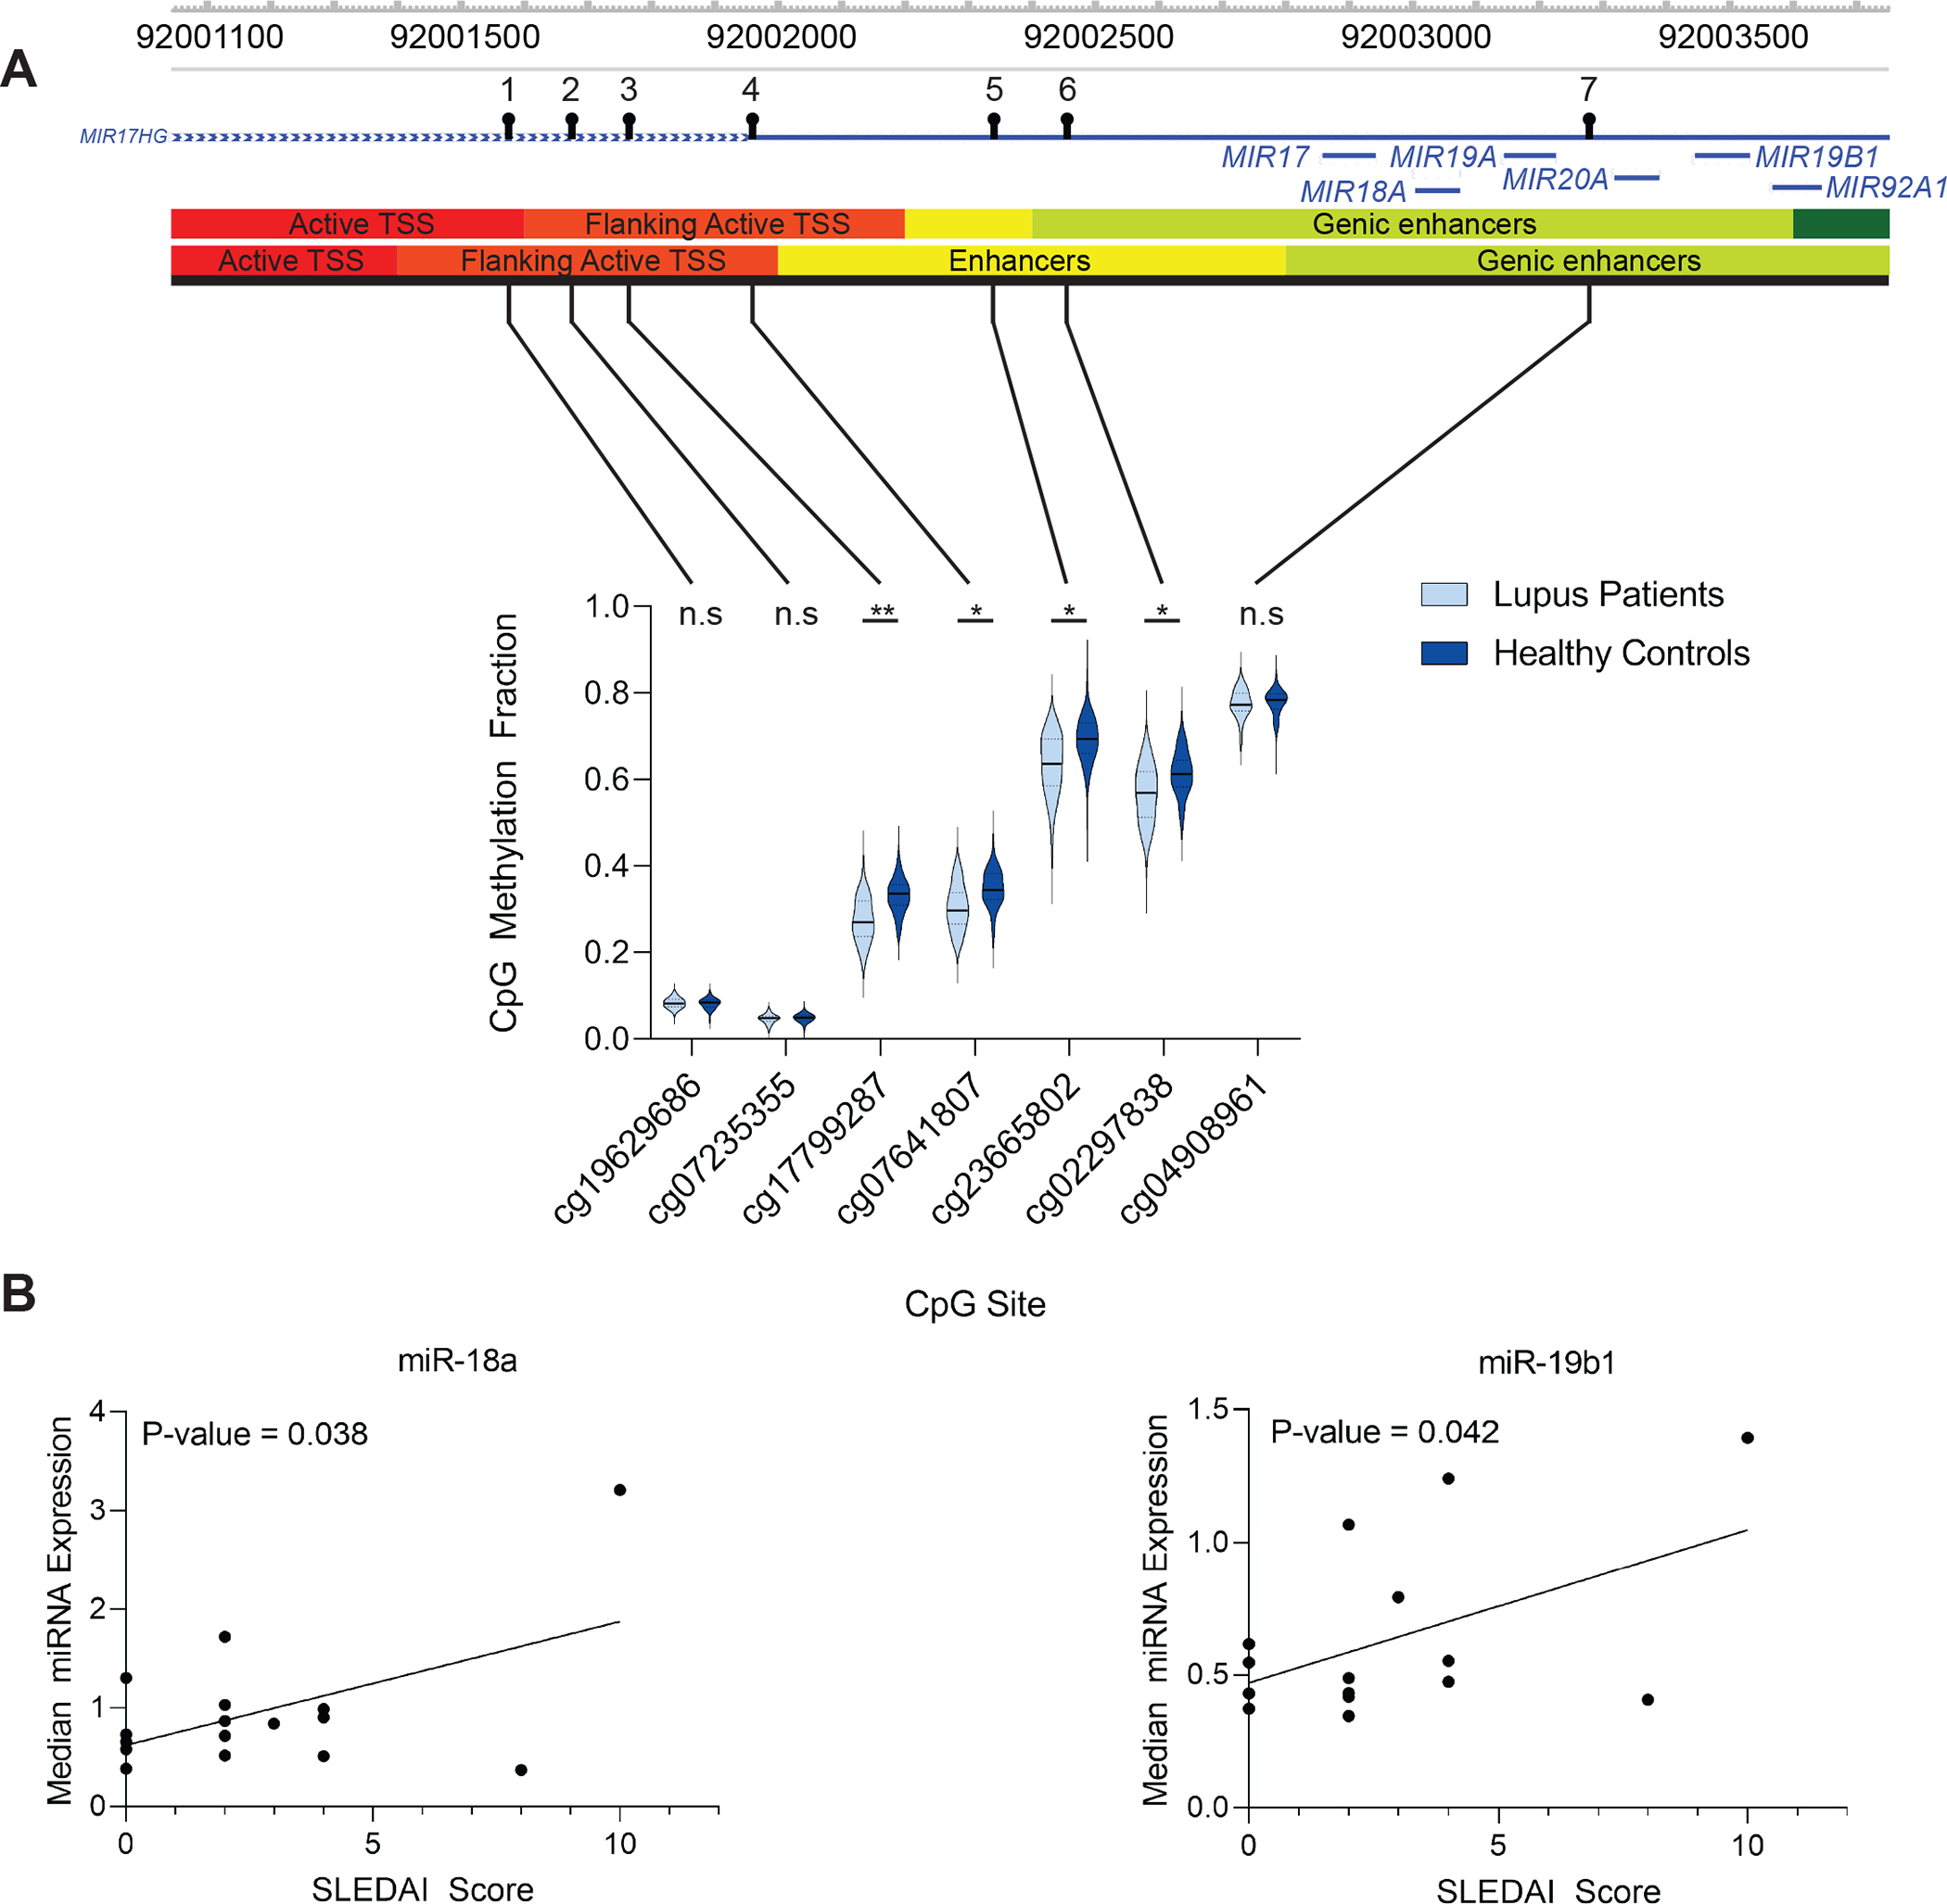
Figure 3.

(A) Violin plots of the seven CG probes in lupus patients and healthy controls used to calculate the average promoter methylation (TSS1500) for the miR-17-92 cluster. The solid black bar represents the median value and the dashed lines the first and third quartiles. Genomic visualization and annotation are from WashU Epigenome Browser using AuxillaryHMM tracks from peripheral naïve CD4+ T cell tissues (E038 and E039, top and bottom tracks, respectively). For P-values: n.s. = not significant, * = P < 0.05, ** = P < 0.01. (B) Correlation of median microRNA expression in naïve CD4+ T cells of a subset (n = 16) of lupus patients with SLEDAI score. Hsa-miR-18a-5p and hsa-miR-19b1-5p had a Pearson correlation (r) of 0.52 (P-value = 0.038) and 0.51 (P-value = 0.042), respectively.
