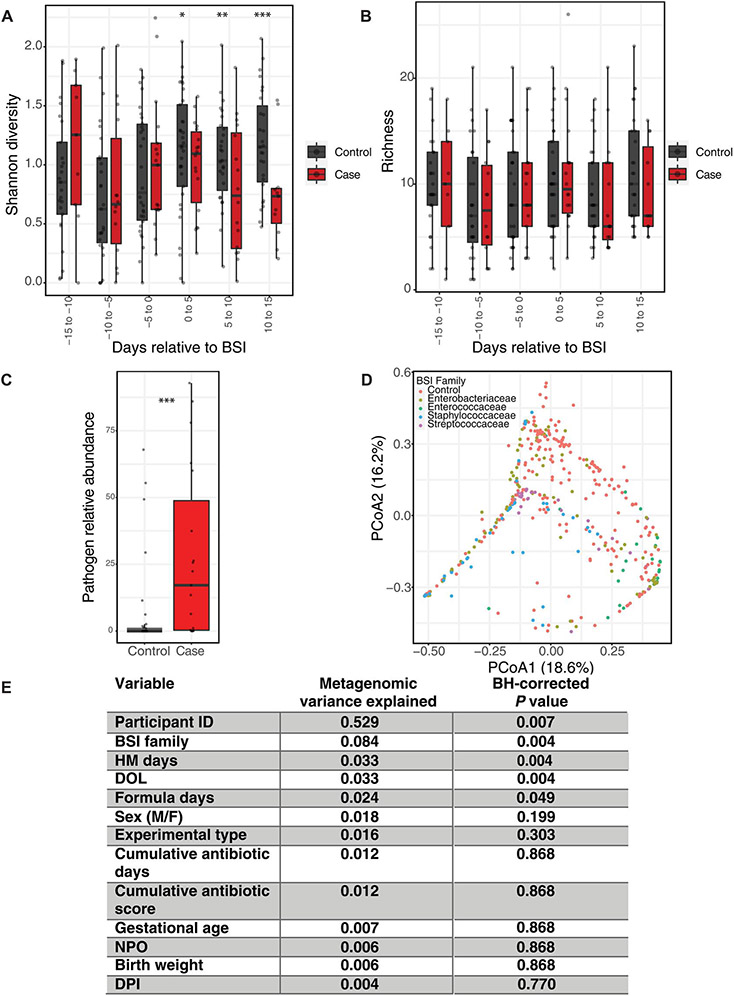
Fig. 2. Greater abundance of BSI species in case stools before infection onset despite no gross alpha diversity differences.
(A) Shannon diversity and (B) species richness displayed within 5-day windows (bins) relative to BSI. Values are averaged within 5-day windows for infants who produced more than one stool within the same 5-day span. (C) Mean relative abundance of BSI-causing species from each case in the 14 days before BSI versus the same species in controls. Mean value for each case species plotted versus abundance of same BSI-causing species in controls in the same DOL range. (D) PCoA of Bray-Curtis dissimilarity is shown by BSI-causing family. Number in parenthesis is percentage of variance explained. (E) Repeated-measures PERMANOVA results for variance contributed and Benjamini-Hochberg–corrected q value. Boxplots represent 25th to 75th median quartile, with horizontal black bar at the median. (A and B) LME model with participant as a random effect. (C) Wilcoxon signed-rank test. *P < 0.05. HM, human milk; DPI, days post infection.

