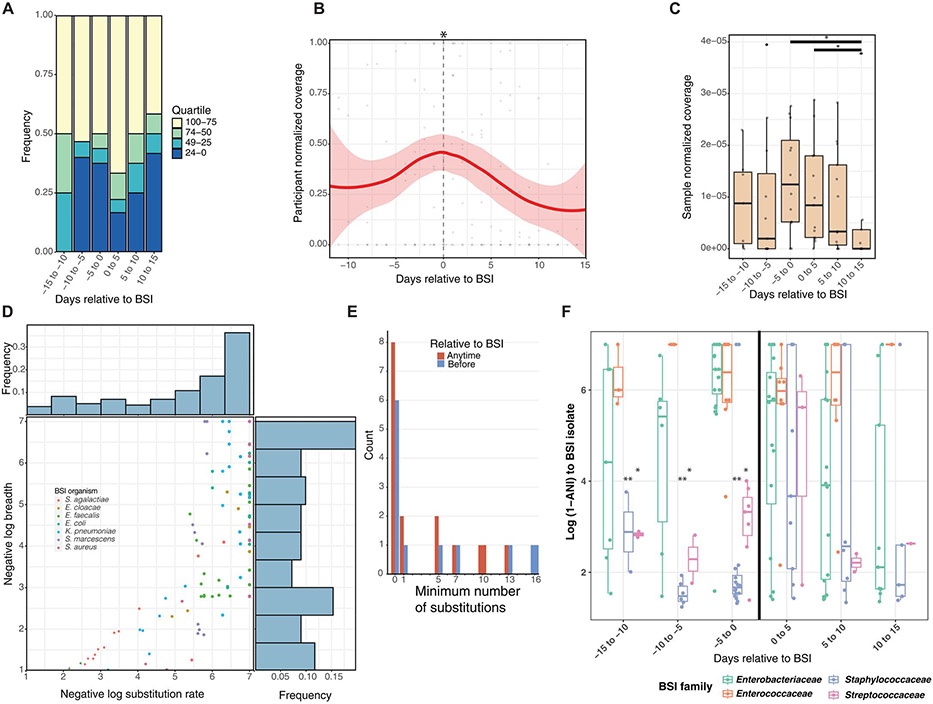
Fig. 4. BSI-causing species and strain increases in abundance before BSI.
(A) Rank abundance quartile of the BSI-causing species is shown within the metagenome relative to BSI. (B) Participant-normalized and sample-normalized (C) coverage of the BSI-causing strain increases to a maximum at the day of BSI and declines thereafter. (D) Negative log breadth and substitution rate are plotted by metagenome to same BSI-causing strain with inStrain. Observations below breadth of 0.5 are not displayed. Frequency bar plots represent observations within that bin for negative log substitutions (top) and negative log breadth (right). (E) Minimum number of substitutions if fewer than 20 is plotted for each individual before BSI (blue) or at any time relative to BSI (red). (F) Degree of relatedness as log (1 – population ANI) between BSI strain and metagenome is plotted by family relative to BSI. (B, C, and F) Using LME models with participant as random effect. *P < 0.05.

