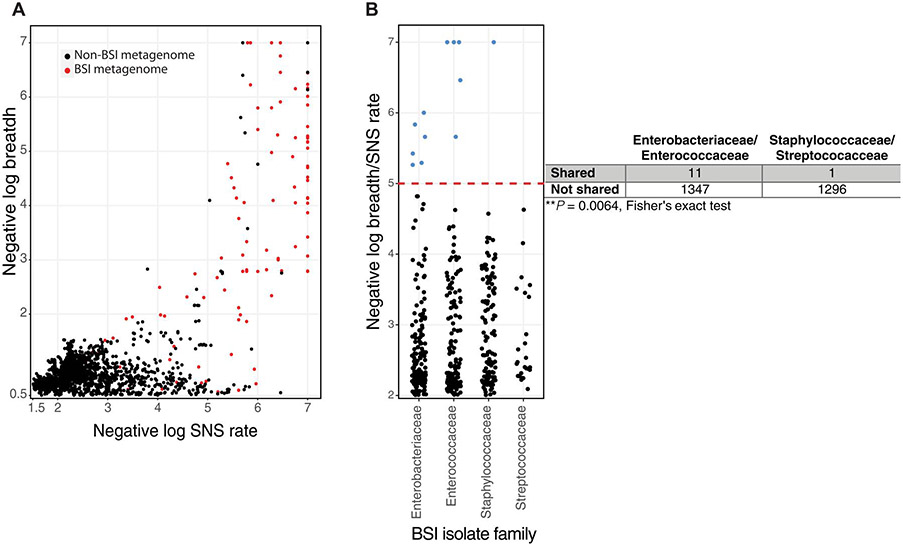
Fig. 5. BSI strains are infrequently shared in the NICU, and sharing differs by causative organism.
(A) InStrain was used to plot BSI isolate reads to metagenomes from the same individual (red) and to all unrelated individuals in the NICU (black). (B) Negative log breadth/substitution rate is plotted by BSI-causing family for each unique non–self-BSI isolate-metagenome pair. Observations above the red dashed line represent negative log breadth/substitution rate above 5 and contain observations with greater than 0.99999 population ANI. Metagenome-BSI mappings below breadth 0.5 were excluded for (A) and (B). Fisher’s exact test for these observations above negative log breadth/substitution rate of 5 compared with all possible nonrelated BSI-metagenome mappings is shown as a two-by-two table.

