
Figure 1. Inhibiting autophagy via ATG5 knockdown in vitro or chloroquine (CQ) treatment in vivo blocks autophagic degradation of HAS2.
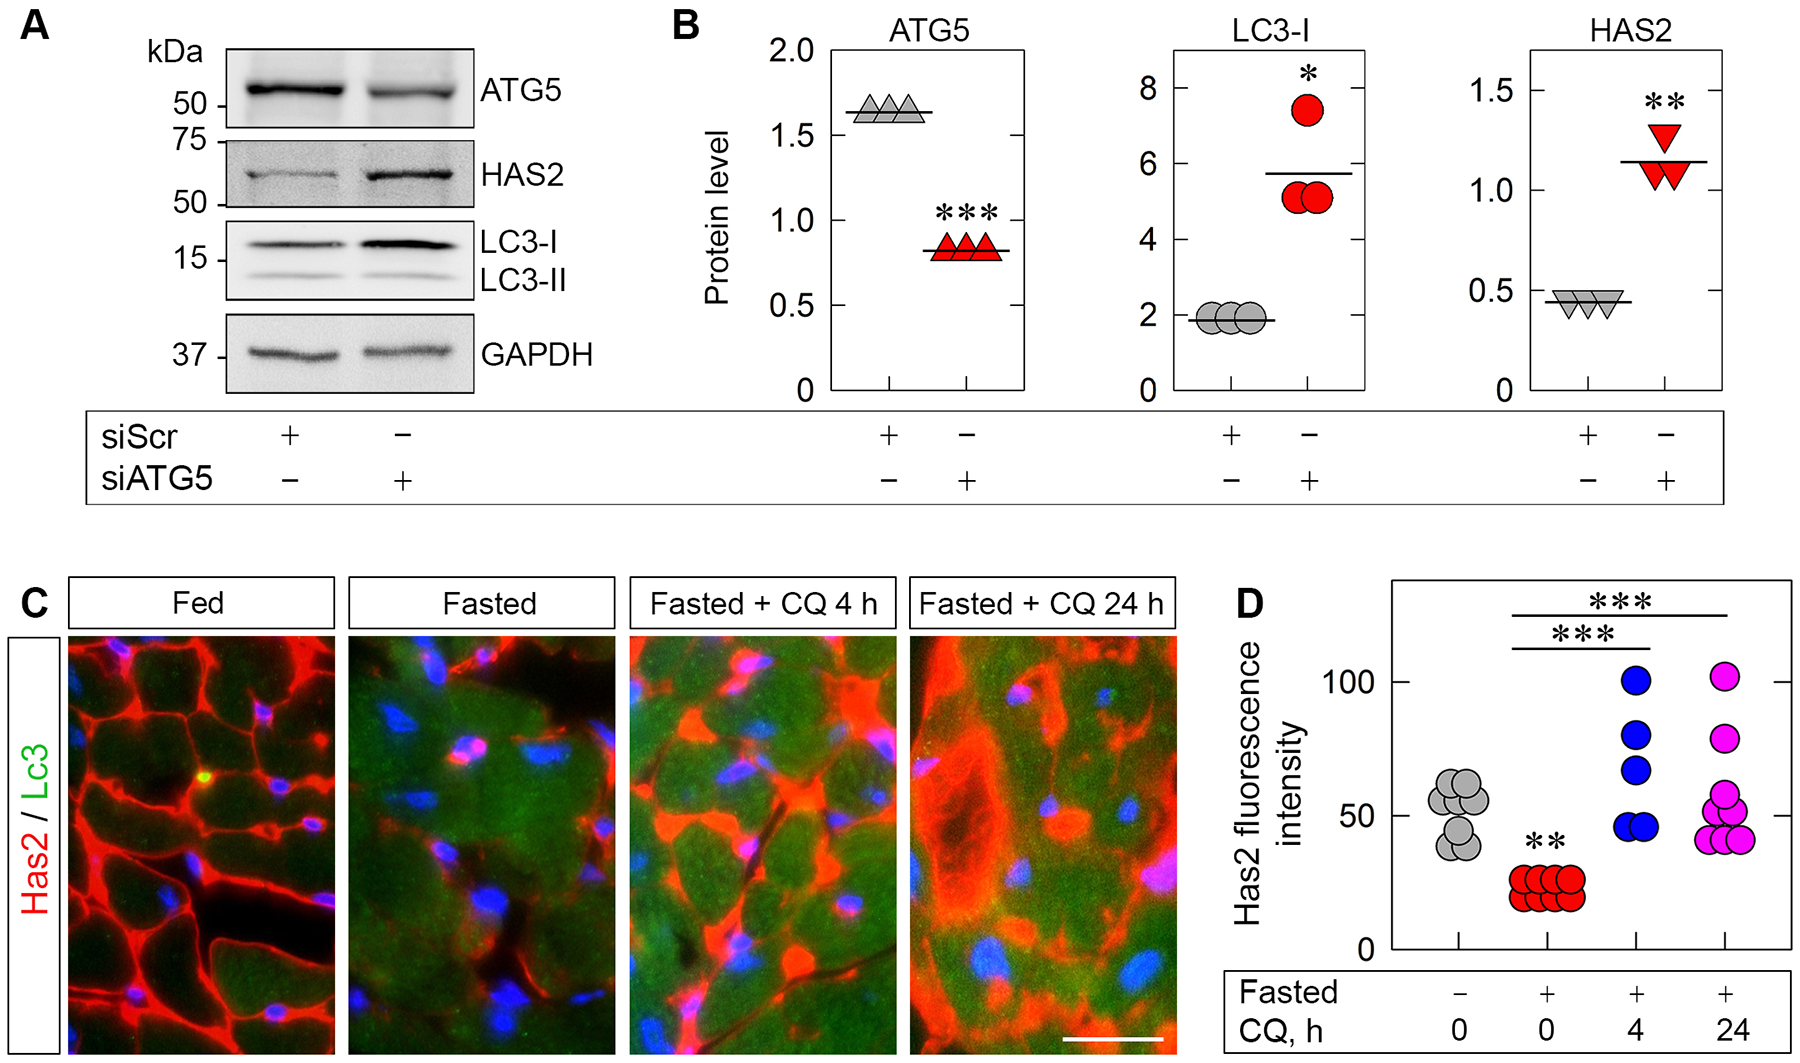
(A) Representative western blot (WB) of HUVEC whole-cell lysates pretreated with scrambled siRNA (siScr) or siRNA targeting ATG5 (siATG5). (B) Quantification of ATG5, LC3-I and HAS2 from A. Statistical analyses were calculated via two-tailed Student’s t test (*p < 0.05, **p <0.01, ***p<0.001). (C) Representative IHC of heart tissue from wild-type mice fasted for 48 h ±chloroquine (50 mg/kg) injected i.p. 4 and 24 h prior to sacrifice. Has2 is labeled in red and Lc3 in green; nuclei are blue. Scale bar, 20 μm. D, quantification of Has2 fluorescence intensity from C; n = 6–8 biological replicates. Statistical analyses were calculated via One-way ANOVA (**p < 0.01, ***p < 0.001).