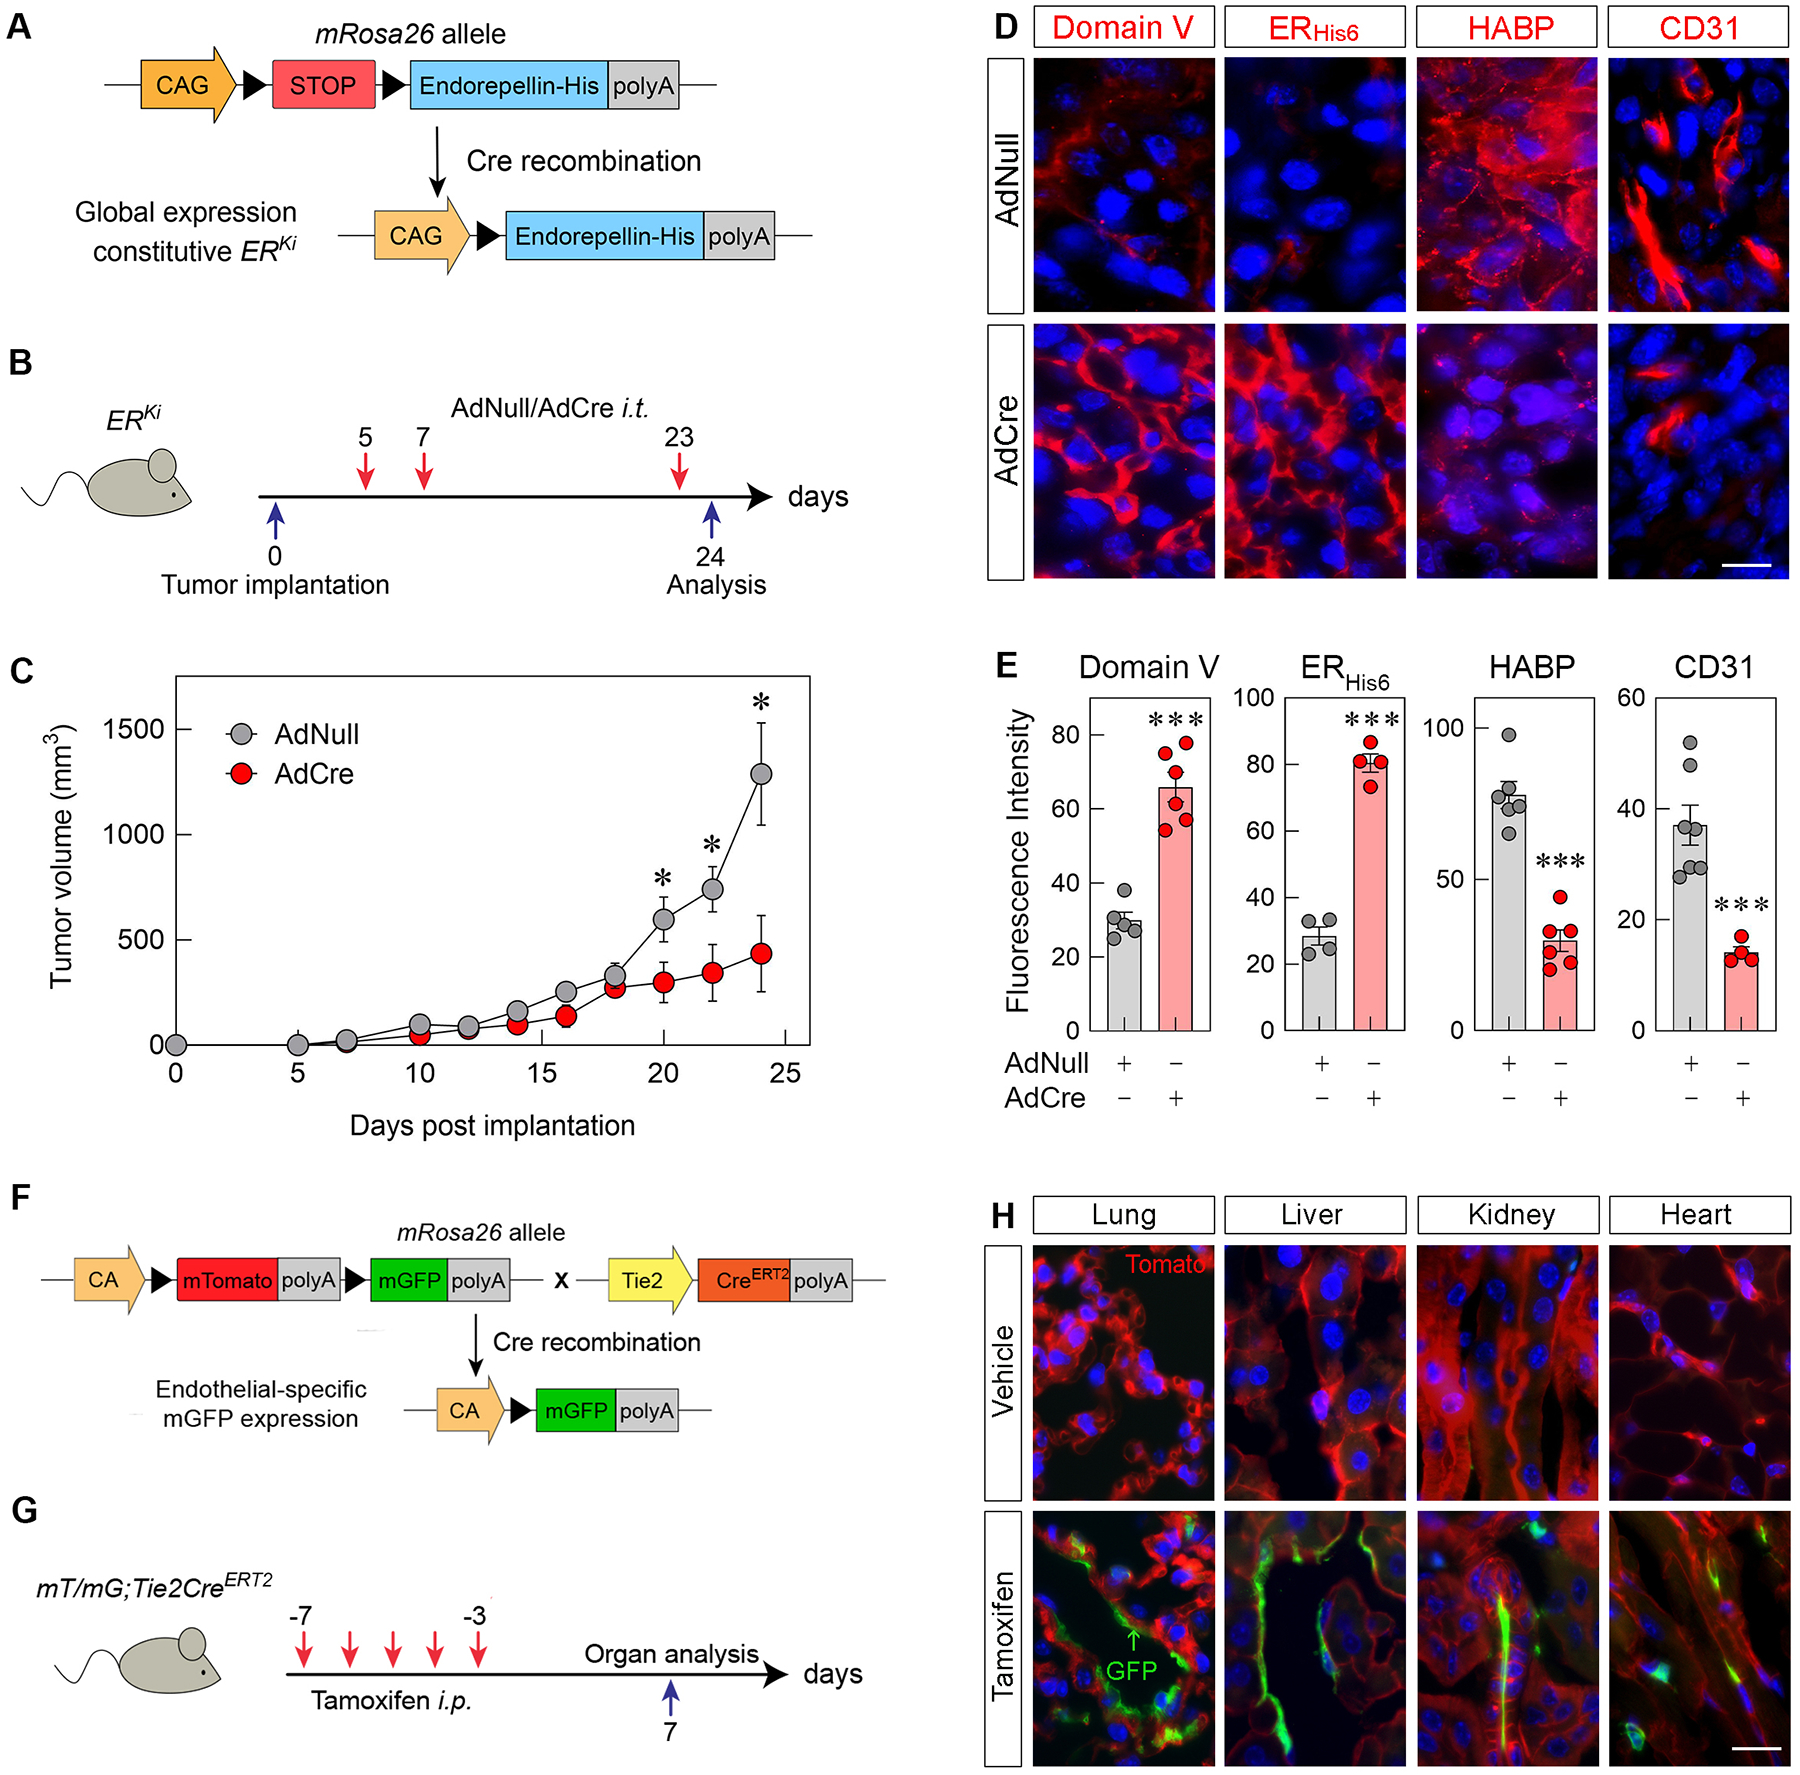
Figure 2. Intratumor overexpression of His-tagged endorepellin (ERHis6) decreases syngeneic E0771 breast tumor allograft growth, angiogenesis and hyaluronan levels in Cre-inducible ERHis6 knock-in (ERKi) mice with validation of Tie2CreERT2 endothelial cell-specific Cre recombinase activity.

(A) Schematic diagram of the ERKi transgene construct before and after Cre recombination. (B) Schematic diagram of the time course treatment of AdNull or AdCre i.t. injections following tumor implantation. (C) Growth of E0771 murine orthotopic breast tumor allografts in ERKi mice treated with AdNull or AdCre; mean ±SEM, n=4 biological replicates. (D) Immunofluorescence of tumor allografts treated with i.t. injections of AdNull or AdCre and labeled for perlecan Domain V, ERHis6, HABP and CD31 (all red). Nuclei are blue; scale bar, 10 μm. (E) Quantification of fluorescence intensity of Domain V, ERHis6, HABP and CD31 in AdNull- or AdCre-treated allografts. Mean ±SEM, n = 3–7 biological replicates each representing 5–15 technical replicates. Statistics calculated via two-tailed Student’s t test (*p < 0.05, **p < 0.01, ***p<0.001). (F) Schematic of the mT/mG;Tie2CreERT2 transgene construct expressing membrane-targeted tdTomato (mT) globally before tamoxifen treatment and membrane-targeted GFP (mG) in endothelial cells following tamoxifen-induced intra-chromosomal recombination via Cre activation. (G) Schematic diagram of the time-course treatment of tamoxifen i.p. injections in mT/mG;Tie2CreERT2 mice. (H) immunofluorescence of lung, liver, kidney and heart tissue from mT/mG;Tie2CreERT2 mice injected with vehicle (corn oil) or tamoxifen. Scale bar, 15 μm.
