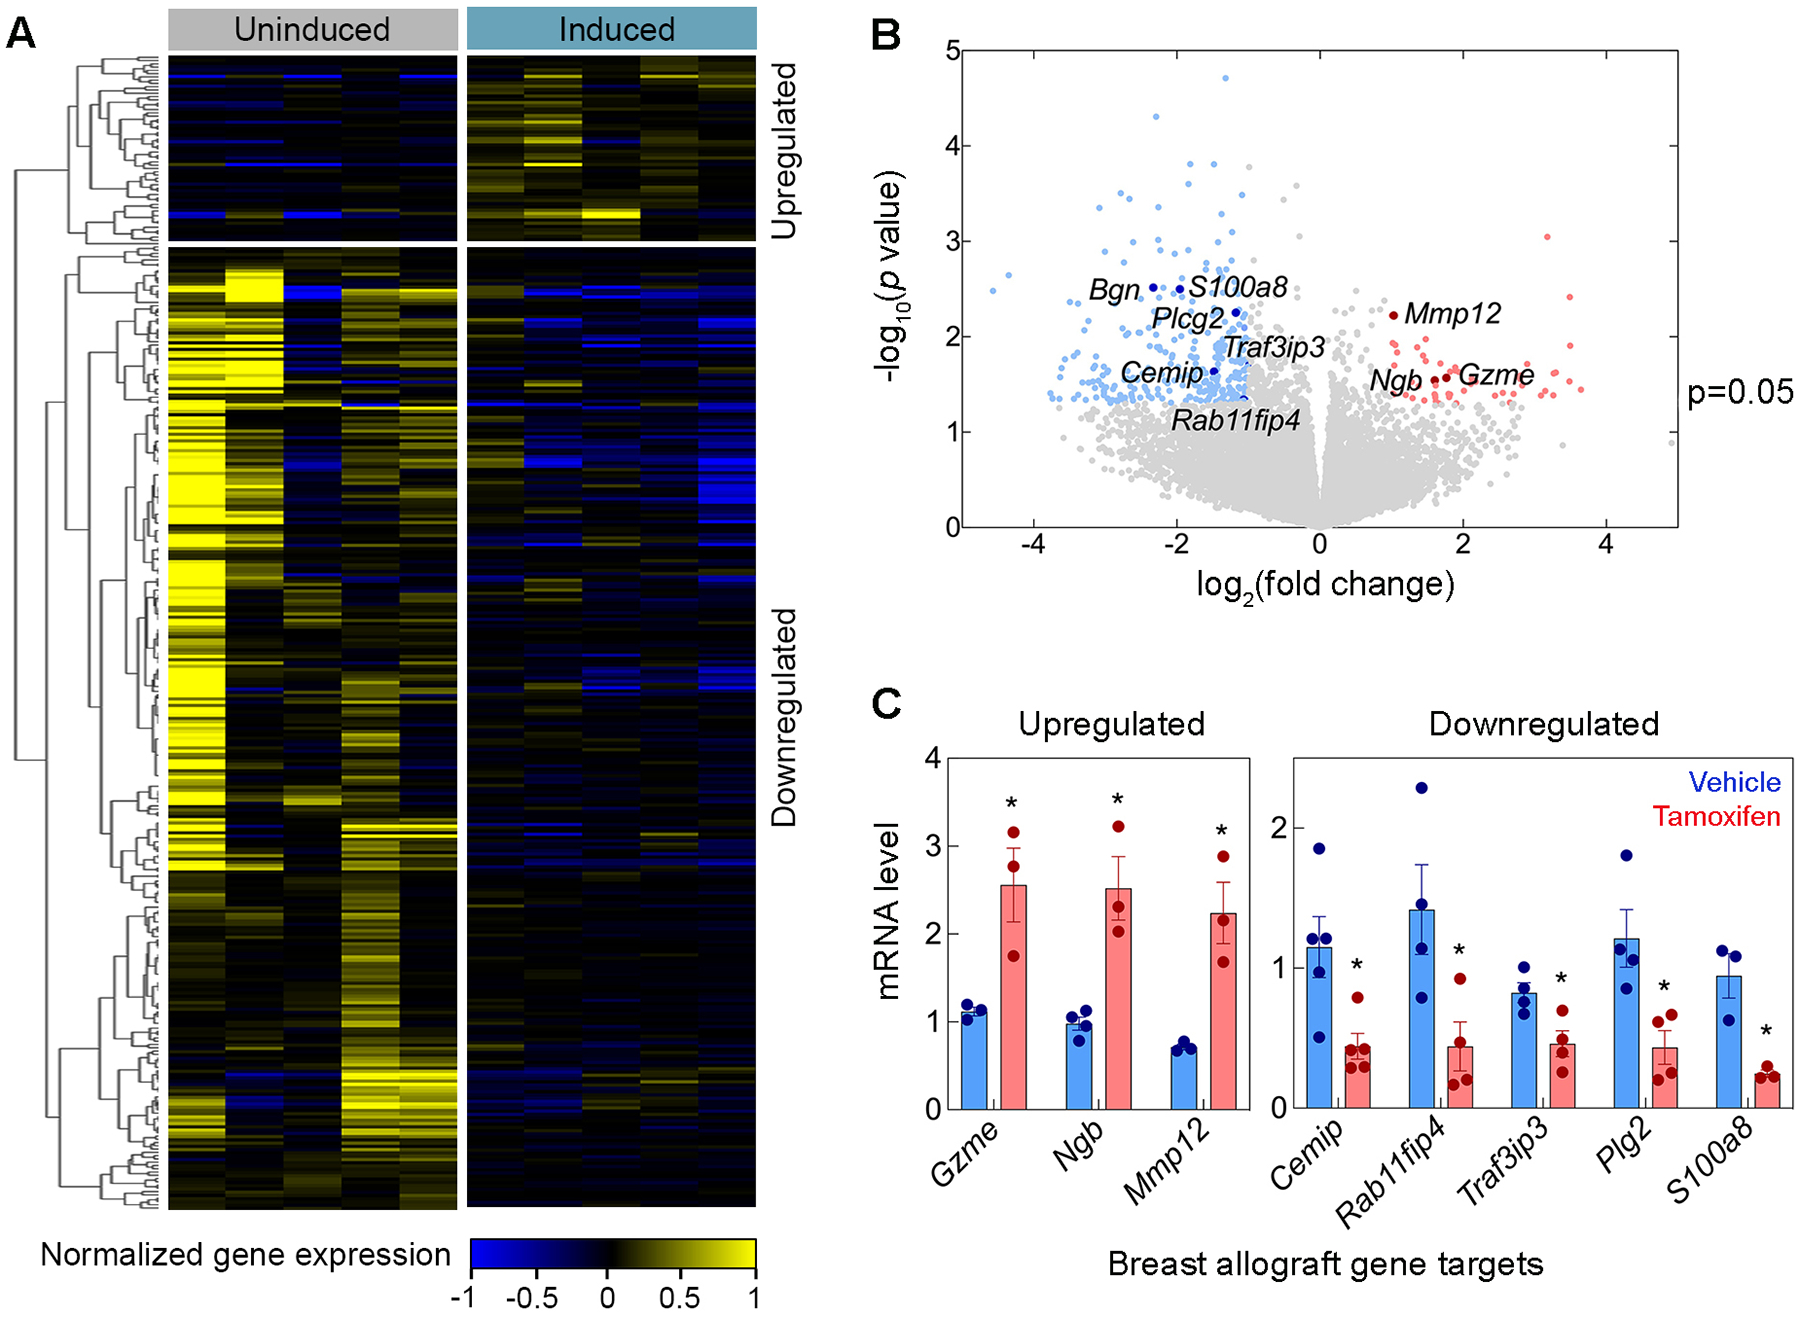
Figure 4. Differential transcriptomic landscape of endorepellin expression in vasculature of E0771 breast allografts.

(A) Heat map and (B) volcano plot displays of differentially expressed genes from Tie2CreERT2;ERKi allografts treated with tamoxifen vs control using RNAseq analysis. Applying parameters of >2-fold change and a p<0.05 resulted in 58 upregulated genes and 294 downregulated genes. (C) Real time qPCR analysis of gene targets from both up- and down-regulated gene datasets confirmed RNAseq findings (blue for vehicle, red for tamoxifen). Statistical analyses were calculated via two-tailed Student’s t test (*p <0.05).
