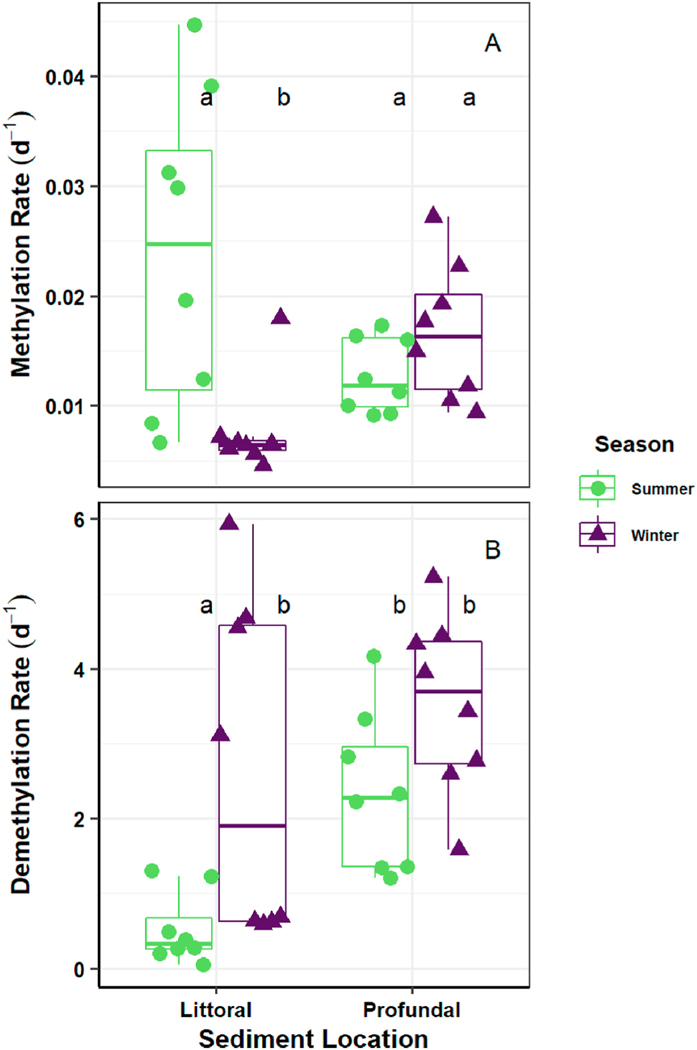
Fig. 6.
Sediment A) methylation and B) demethylation rates. Summer boxplots are green (Sept. 2015; left of each pair); winter boxplots are purple (Jan. 2016; right of each pair). Individual datapoints used to construct each boxplot are displayed as circles (summer) and triangles (winter). A summary of methylation and demethylation rates in sediment can also be found in Table S6.

