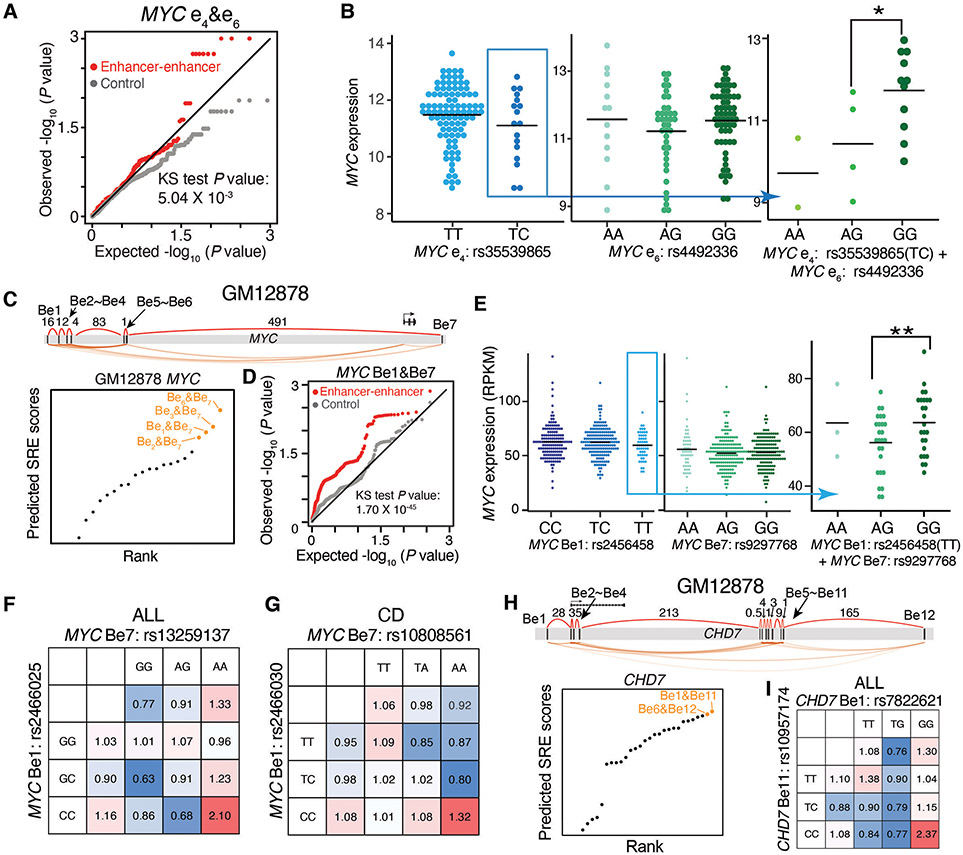
Fig. 5. Synergistic interactions between predicted SRE variants influence gene expression and disease risk in an epistatic manner.
A-B, Analysis of predicted SRE variants at the MYC locus in K562 cells for influence on gene expression. A, quantile-quantile (QQ) plot showing the distribution of P values for the epistasis influence on MYC expression between e4&e6 variants (red) in LAML patients, compared to random permutations (grey); P value in Kolmogorov–Smirnov (KS) test. B, MYC expression in LAML patients stratified by e4&e6 SRE variants. * P < 0.05 in Wilcoxon test.
C-G, Analysis of predicted SRE variants at the MYC locus in GM12878 cells for influence on gene expression and associated disease risk. C, Diagram showing the rank of predicted SREs; orange dots show top SREs. D, QQ plot showing the distribution of P values for the epistasis influence of Be1&Be7 variants (red) on MYC expression in the B lymphoblasts of 373 European individuals, compared to random permutations (grey). P value in KS test. E, MYC expression in the B lymphoblasts from individuals stratified by Be1&Be7 variant. ** P < 0.01 in Wilcoxon test. F-G, Calculated odds ratio on the relapse risk in acute lymphoblastic leukemia (ALL) (F) and Crohn's disease (CD) (G). Odds ratios are calculated by considering the genotypes of individual variants or both SRE variants. Colors represent the odds ratios.
H-I, Analysis of predicted SRE variants at the CHD7 locus in GM12878 cells for influence on ALL. H, Diagram showing the rank of predicted SREs; orange dots show top SREs. I, Calculated odds ratio on the relapse risk in ALL. Odds ratios are calculated by considering the genotypes of individual variants or both SRE variants. Colors represent the odds ratios.

