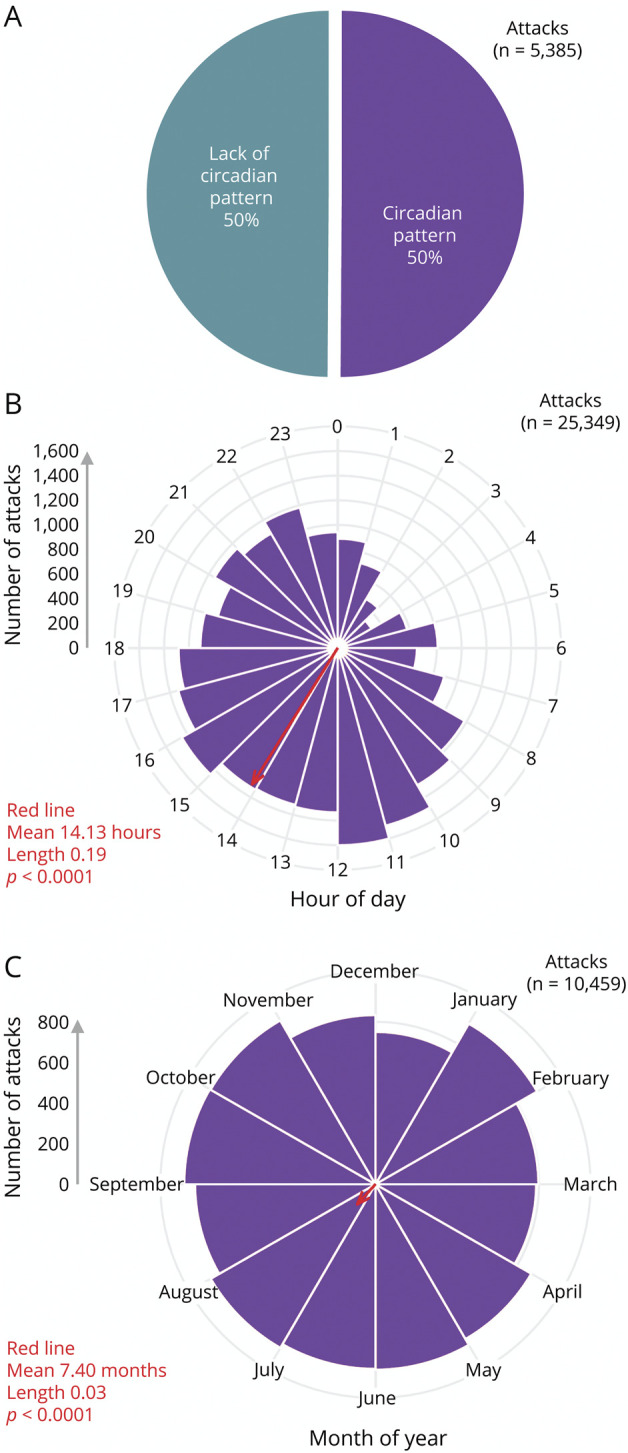
Figure 6. Meta-analysis of Predictable Timing of Participants With Migraine for (A) the Presence or Absence of a Circadian Pattern, (B) the Circadian Pattern of Attacks Hour by Hour, or (C) the Circannual Pattern of Attacks Month by Month.

Rayleigh test data (in red) is shown for mean, length, and p value. The average time across all attacks (red arrows) was 14.13 hours and 7.4 months or 14:08 on July 12. Both the hour-by-hour and month-by-month data were significantly different between cluster headache and migraine (Watson 2 test p < 0.01). Of note, a single participant could respond once for A but multiple times for B or C. Additional analysis, including bar graphs, circadian 2-hour blocks, individual contributions from each study, and raw data, is available in eFigures 3 and 4 (links.lww.com/WNL/C706 and links.lww.com/WNL/C707) and eTables 7–9 (links.lww.com/WNL/C709).
