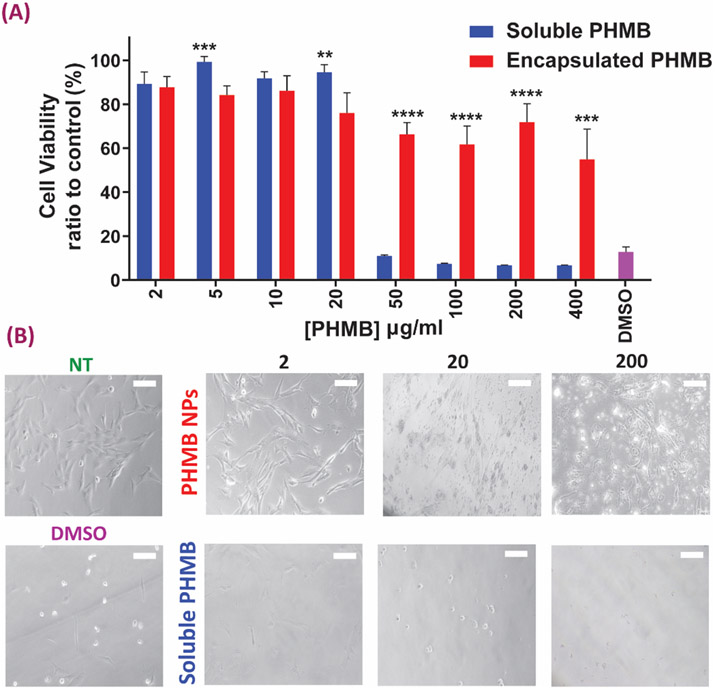
Figure 5.
Cytotoxicity evaluation of the NPs with different concentrations plain vs. loaded (A) Results of cell viability after soluble and encapsulated PHMB treatment of human dermal fibroblasts (HDFs). Data all n = 6, mean ± S.D. Asterisks denote significance as determined by pairwise t-tests with ** p = 0.01, *** p < 0.001 and **** p <0.0001 . (B) Morphological changes of HDF cells after soluble/encapsulated PHMB exposure for 24 h (scale bars = 50 μm). NT indicates the no-treatment media only control group.

