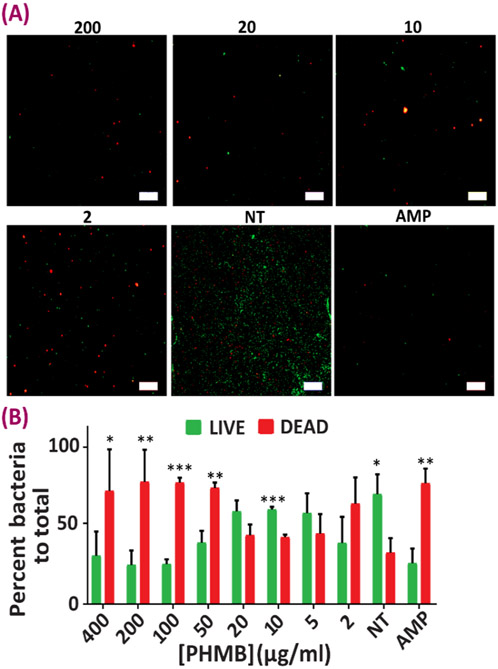
Figure 7.
Antibacterial evaluation of the NPs against E. faecalis. (A) Representative images from Live-Dead analysis of E. faecalis after being in contact with different nanoparticle concentrations for 24 hours (live cells are stained green and dead cells are showing up as red). (B) Quantification analysis results of Live-Dead analysis of E. faecalis after being in contact with different nanoparticle concentrations for 24 hours. Data all n = 4, mean ± SD. Asterisks denote significance as determined by pairwise t-tests with * showing p < 0.05, ** p < 0.01 and *** p < 0.001.

