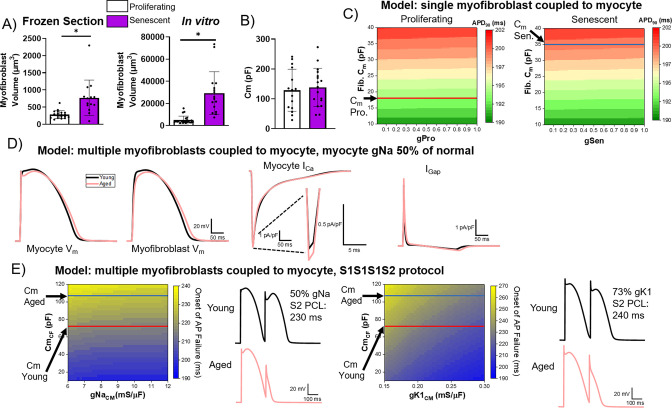
Figure 9. Computational modeling of myocyte-myofibroblast interactions.
(A) Quantification of proliferating and senescent myofibroblast volume from immunofluorescent staining against WGA and γH2AX of frozen tissue sections (left) and adult rabbit cardiac fibroblasts in vitro. (B) Quantification of capacitance of patch clamped proliferating and senescent adult rabbit cardiac myofibroblasts. (C) Modeling of action potential duration (APD)90 from a single myocyte coupled to a single proliferating or senescent fibroblast with gradients of myofibroblast conductance (gPro and gSen) and myofibroblast capacitance. (D) Modeling of myocyte (first panel) and myofibroblast (second panel) action potential traces, as well as ICa and IGap traces from young and aged modeling conditions. (E) S1S2 modeling of young and aged conditions showing onset of action potential failure with gradients of Na channel conductance (gNa) and myofibroblast capacitance, with representative action potential traces (left) and onset of action potential failure with gradients of myocyte inward rectifier channel conductance (gK1) and myofibroblast capacitance, with representative action potential traces (right). Dots represent average data for each cell, error bars SEM. * p<0.05, two-tailed exact test.


