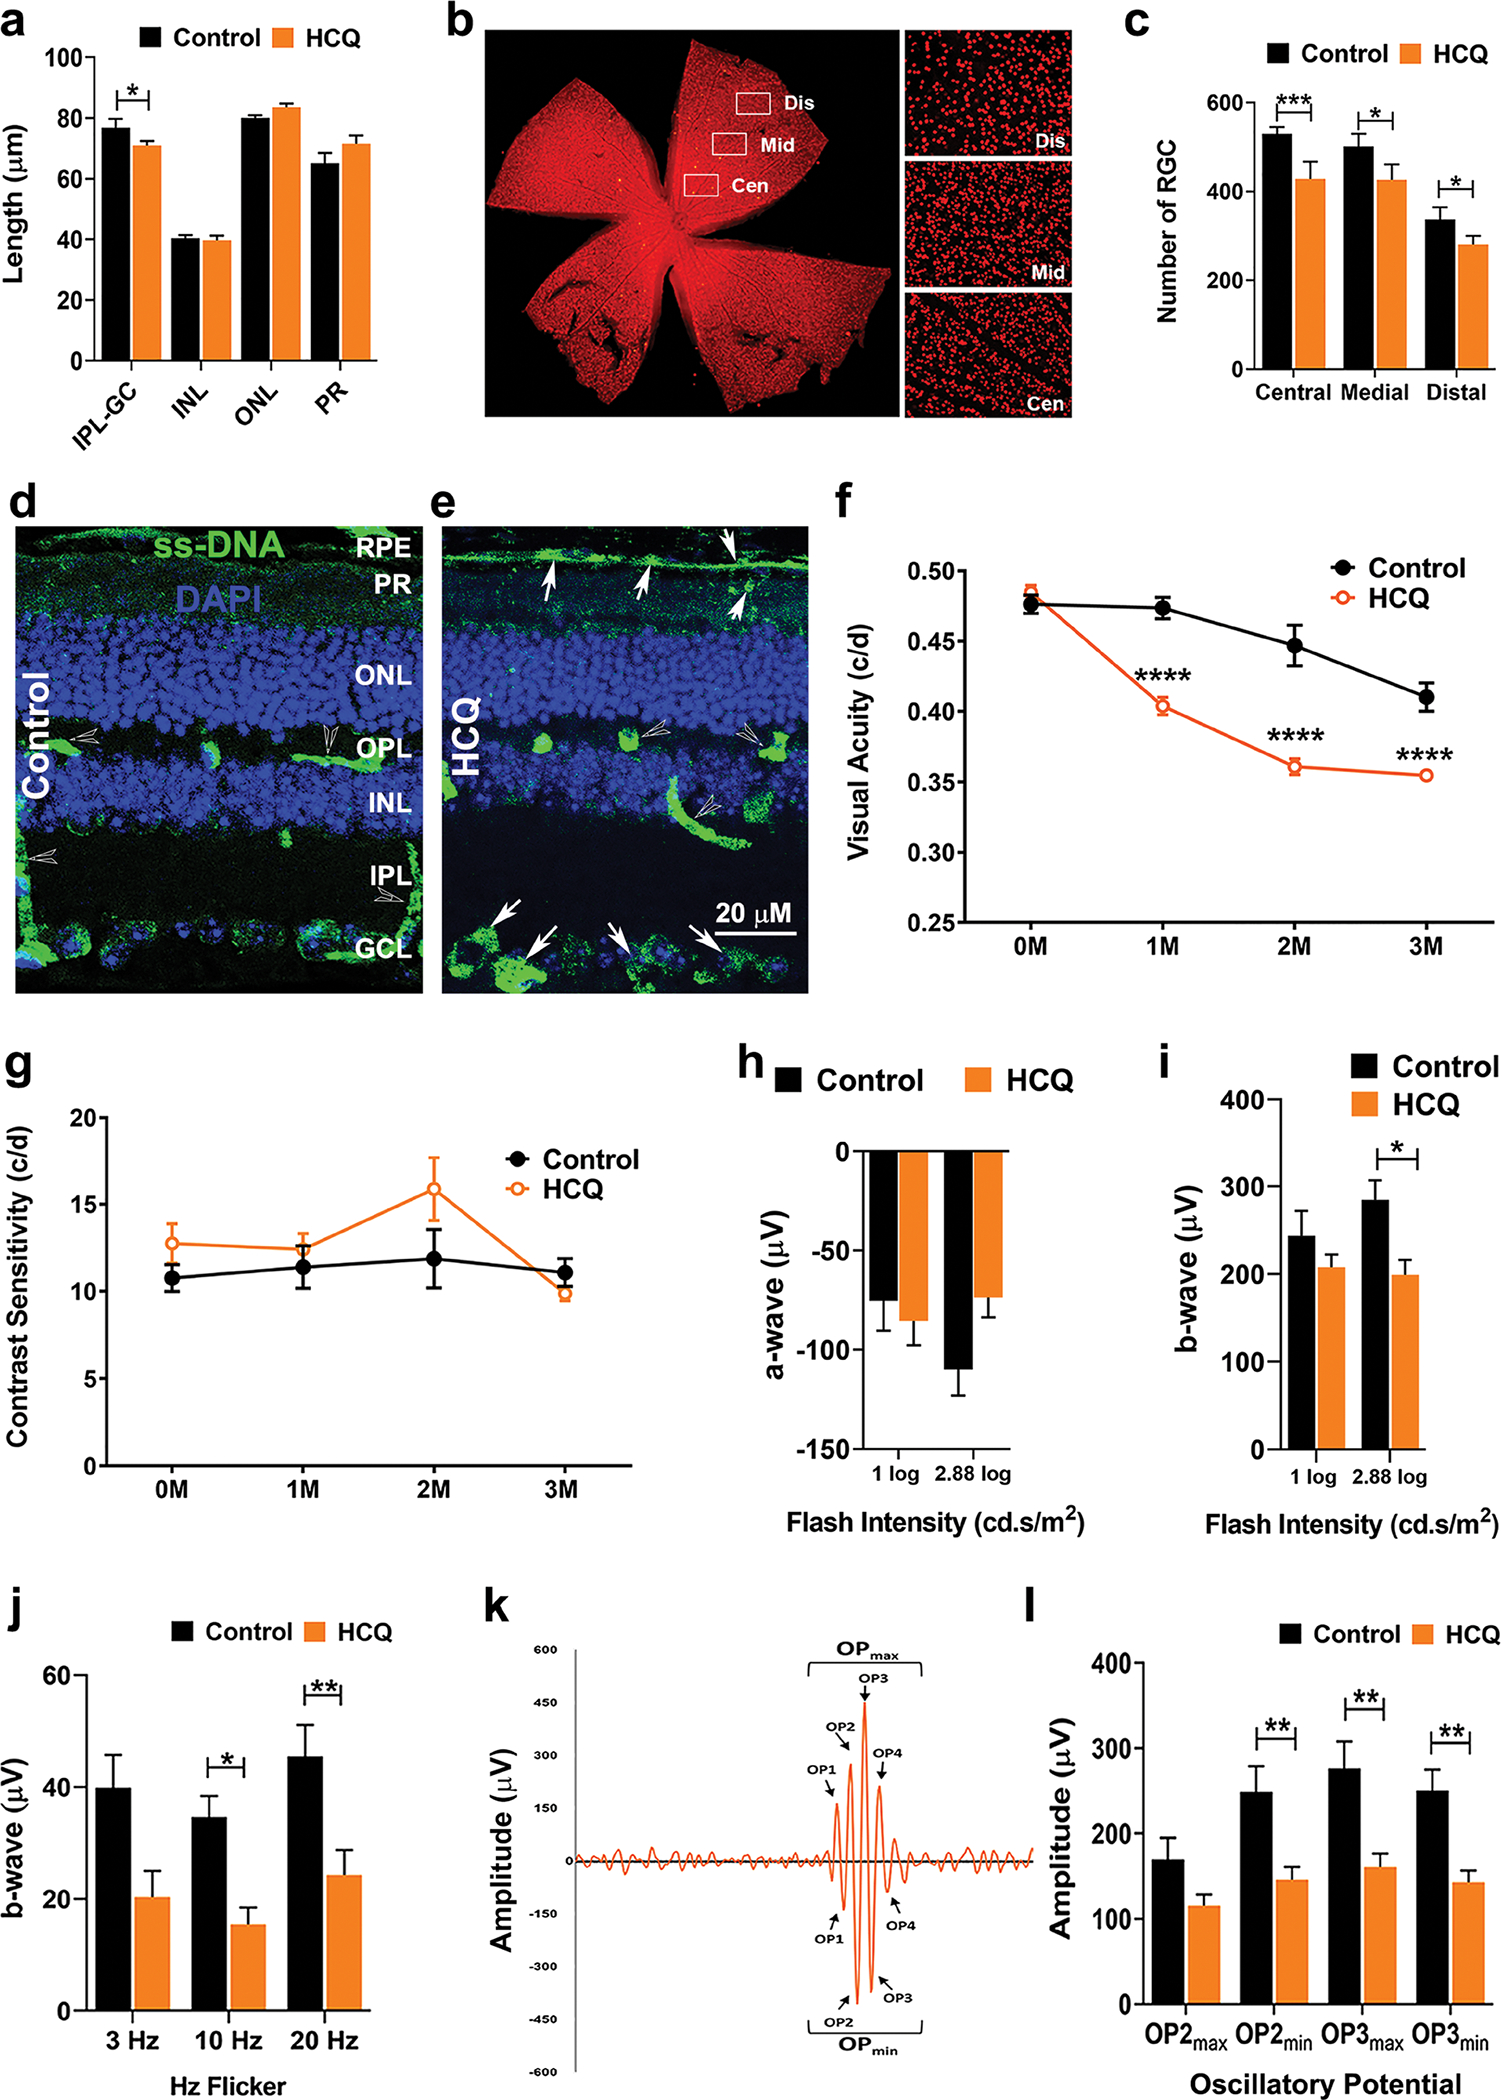
Fig. 2. Retinal structure and functions were altered in mouse model of chronic HCQ exposure.

(a) Thickness of different retinal layers of mice after 3 months of HCQ treatment along with untreated controls as measured by SD-OCT. (b) Retinal flat mount of untreated mice immunohistochemically stained for Brn3a showing the retinal ganglion cells (RGC) and the three arbitrary regions of the retina used for measurement of RGC numbers. (c) RGC numbers from the three regions marked in b in control and HCQ-treated mice. (d and e) Representative image of immunohistochemistry of control (d) and 3 months of HCQ-treated (e) mice retina showing the level of single-stranded DNA (ssDNA). Arrows indicate higher level of ssDNA at retinal pigment epithelial (RPE) and RGC cell layers in the treated retina. Visual acuity (f) and contrast sensitivity (g) of control and HCQ-treated mice (n = 10 and 12, respectively) from pre-treatment to 3 months post-treatment. (h–l) Electroretinogram (ERG) of control and HCQ-treated mice (n = 12 and 20, respectively) after 3 months of treatment showing scotopic a-wave (h), b-wave (i) and photopic b-wave showing Hz flickers (j). (k) Representative diagram of oscillatory potential (OP) of b-wave in scotopic ERG showing minimum and maximum OPs measured and (l) graphical representation of OP2 and OP3. (All values are mean ± SEM; t-test; *p < 0.05, **p < 0.01, ***p < 0.001)
